How to Build a Roadmap – Gap Analysis Update

update-stock-imageI have received a number of requests about the tools and methods used to complete the gap analysis steps from earlier posts in the series How to Build a Roadmap. In this series I have discussed the specific steps required to develop a well thought out road map where one of the key tasks was conducting a gap analysis exercise. Understanding the limits of a medium like this I have posted this update to explore the questions in a little more detail. Believe this will be extremely useful to anyone building a meaningful road map. The internet is full of simply awful templates and tools which range from the downright silly to extremely dangerous in their simple assumptions where there is no attempt to quantify results. Even more distressing is lack of understanding of how to use and leverage the best data sources you already have – the professionals within your own organization. Save yourself some time and read on.

Recall the road map development identified specific actions using an overall pattern ALL road maps should follow. The steps required to complete this work:

  1. Develop a clear and unambiguous understanding of the current state
  2. Define the desired end state
  3. Conduct a Gap Analysis exercise
  4. Prioritize the findings from the Gap Analysis exercise into a series of gap closure strategies
  5. Discover the optimum sequence of actions (recognizing predecessor – successor relationships)
  6. Develop and Publish the Road Map

The Gap Analysis step discussed how to develop a robust analytic to find any significant shortcomings between the current and desired end states. We use these findings to begin develop strategy alternatives (and related initiatives) to address what has been uncovered. Our intent is to identify and quantify the difference (delta) from where we are to what we aspire to become. This exercise is critical to find what needs to be accomplished. The gap analysis leads to a well-organized set of alternatives and practical strategies we can use to complete the remaining work. You can review the full post here.

Gap Analysis

Gap Analysis

The goal? Seek a quick and structured way to define actionable activities to be reviewed and approved by all stakeholders. We would like focus on the important actions requiring attention. This includes identifying a set of related organizational, functional, process, and technology initiatives needed. The gap closure recommendations give a clear line of sight back to what needs to be accomplished to close the “delta” or gaps uncovered in the analysis.

What is needed than is a consistent, repeatable way to evaluate quickly where an organization is, where they want to go, and the level of effort needed to accomplish their goals with some precision. In short the delta between current and desired state is uncovered, quantified, and ready for a meaningful road map effort based on factual findings supported by real evidence captured in the field. Performing a successful gap analysis begins with defining what you are analyzing which could be processes, products, a region, or an entire organization. Even at the overall organizational level, knowing what aspect you are analyzing is crucial to find and understand the intent and findings of the effort. Quickly focusing at the desired level of detail means we can now:

  • Know where to go; what really needs attention
  • Pinpoint opportunity…quickly.
  • Uncover what is preventing or holding back an important initiative
  • Know what to do – and in what suggested order

This is where problem solving using some quick management diagnostic tools can be used across a variety of challenges met when developing a road map. Using these tools to perform the gap analysis delivers quick distinctive results and provides the key data and actionable insight needed to develop a meaningful road map. This method (and the tools) can be used to:

  • evaluate capability using a generally accepted maturity model specific to the business,
  • focus on a specific subject area or domain; Master Data Management or Business Intelligence are two examples were known proven practice can be used as starting point to support the findings compiled,
  • assess the readiness of an important program or evaluate why it is in trouble,
  • evaluate and uncover root cause issues with a struggling project,
  • detect and measure what requires immediate attention by uncovering weaknesses where proven practice has not been followed or adopted.

Quick Management diagnostic tools
The tool set I use follows the same general pattern and structure, only the content or values differ based on how focused the effort is and what is needed to complete the work successfully. The questions, responses, and data points gathered and compiled are usually organized in a structured taxonomy of topics. See the earlier post (Define End State) for more on this. The key is using the same engine to tabulate values based on responses that can range from zero (0 – Never or No) to five (5 – Always or Yes). Of course you can customize the responses. In fact I have done this with a Program Readiness Assessment and BigData Analytics tool. The real point is to quantify the responses received. The engine component takes the results builds a summary, and produces accompanying tabs where radar graphs plots present the Framework, Topic, Lookup, # Questions, Current State Scores, Desired End State Scores, and common statistical results within each grouping. The tool can be extended to include MS Word document templates which then link to the findings worksheet and grabs the values and charts produced to assemble the draft document ready for further editing and interpretation. If all this sounds confusing, a couple of examples may be helpful.

Using the Data Maturity Model (CMMI) to Evaluate Capability
The Data Maturity Model (DMM) was developed using the principles and structure of CMMI Institute’s Capability Maturity Model Integration (CMMI)—a proven approach to performance improvement and the gold standard for software and systems development for more than 20 years. The DMM model helps organizations become more proficient in managing critical data assets to improve operations, enable analytics and gain competitive advantage.

Using this body of knowledge and a library of source questions we can elicit current state and desired end state responses using a simple survey. This can be conducted online, in workshops, or traditional interviews as needed. The responses are compiled and grouped to evaluate the gap closure opportunities for an organization wishing to improve their data management practices by identifying and taking action to address shortcoming or weaknesses identified. The framework and topic structure of the 142 questions are organized to match the DMM model. DMM_Topics
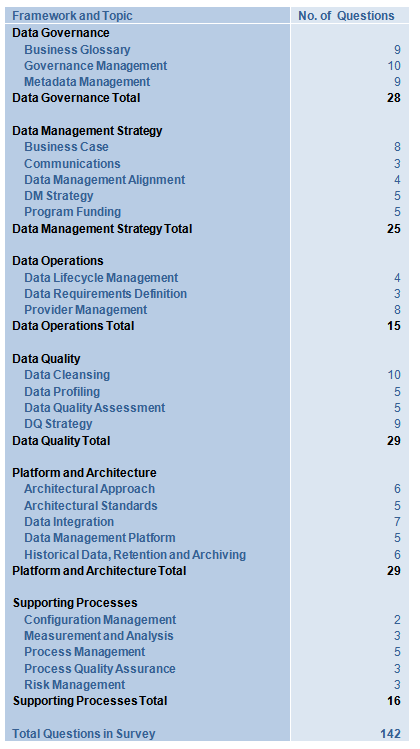
Looking closer we find the nine (9) questions used to elicit responses related to Business Glossaries within the Data Governance topic.

1) Is there a policy mandating use and reference to the business glossary?
2) How are organization-wide business terms, definitions, and corresponding metadata created, approved, verified, and managed?
3) Is the business glossary promulgated and made accessible to all stakeholders?
4) Are business terms referenced as the first step in the design of application data stores and repositories?
5) Does the organization perform cross-referencing and mapping of business-specific terms (synonyms, business unit glossaries, logical attributes, physical data elements, etc.) to standardized business terms?
6) How is the organization’s business glossary enhanced and maintained to reflect changes and additions?
7) What role does data governance perform in creating, approving, managing, and updating business terms?
8) Is a compliance process implemented to make sure that business units and projects are correctly applying business terms?
9) Does the organization use a defined process for stakeholders to give feedback about business terms?

Responses are expected to include or more of the following values describing current state practice and what the respondent believes is a desired end state. These can simply be a placed on a scale where the following values are recorded for both current and desired outcomes.

Responses
0 – Never or No
1 – Awareness
2 – Occasionally
3 – Often
4 – Usually
5 – Always or Yes

In this example note how the relatively simple response can be mapped directly into the scoring description and perspective the DMM follows.

0 – No evidence of processes performed or unknown response.

1 – Performed Processes are performed ad hoc, primarily at the project level. Processes are typically not applied across business areas. Process discipline is primarily reactive; for example, data quality processes emphasize repair over prevention. Foundational improvements may exist, but improvements are not yet extended within the organization or maintained. Goal: Data is managed as a requirement for the implementation of projects.

2 – Managed Processes are planned and executed in accordance with policy; employ skilled people with adequate resources to produce controlled outputs; involve relevant stakeholders; are monitored and controlled and evaluated for adherence to the defined process. Goal: There is awareness of the importance of managing data as a critical infrastructure asset.

3 – Defined Set of standard processes is employed and consistently followed. Processes to meet specific needs are tailored from the set of standard processes according to the organization’s guidelines. Goal: Data is treated at the organizational level as critical for successful mission performance.

4 – Measured Process metrics have been defined and are used for data management. These include management of variance, prediction, and analysis using statistical and other quantitative techniques. Process performance is managed across the life of the process. Goal: Data is treated as a source of competitive advantage.

5 – Optimized Process performance is optimized through applying Level 4 analysis for target identification of improvement opportunities. Best practices are shared with peers and industry. Goal: Data is critical for survival in a dynamic and competitive market.

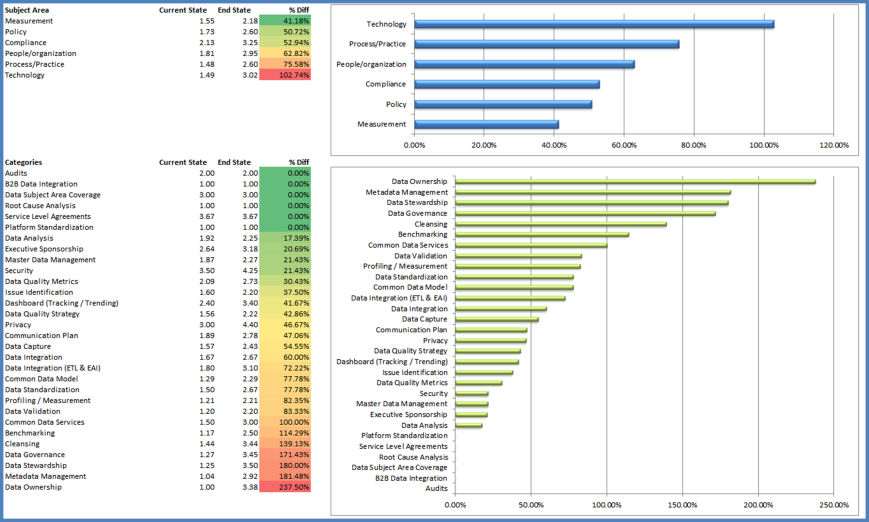
The key here is capturing both current state (what is being performed now) and the desired end state capability using this tool. The difference or delta between the two values now becomes a data set we can use analytic tools to reveal where the greatest challenges are. In this example the clear gaps (represented in orange and red visual cues) show where we should focus our immediate attention and call for further investigation. Yellow shaded topics are less urgent. All green shaded topics don’t need the same rigor when addressing the actions needed in the road map developed in later stages.

DMM_Focus

Specific Subject Area – Master Data Management Assessment
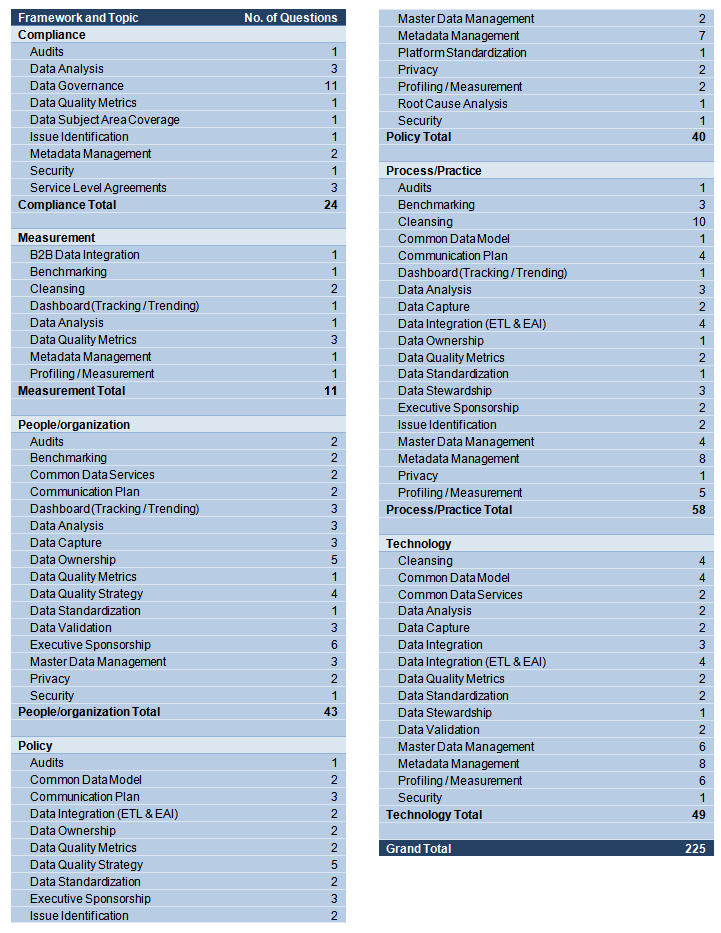
In this example we can extend and focus on Master Data Management using the same principles and structure of CMMI Institute’s Capability Maturity Model Integration (CMMI), adding proven practice in the Master Data Management domain. Note the framework and topic structure is far more focused to match the MDM model framework. And the library of survey questions used here (225 questions) are far more detailed and now very much focused on Master Data Management.

MDM_Topics

Using the same scoring engine we have captured both current state (what is being performed now) and the desired end state capability using this tool. The difference or delta between the two values now becomes a data set we can use analytic tools to reveal where the greatest challenges are. The clear gaps (represented in orange and red visual cues) pop off the page when the size and relative distance from desired or needed and current practice is measured. Now there is a good idea of what needs to be addressed in the road map developed in later stages.

MDM_Focus

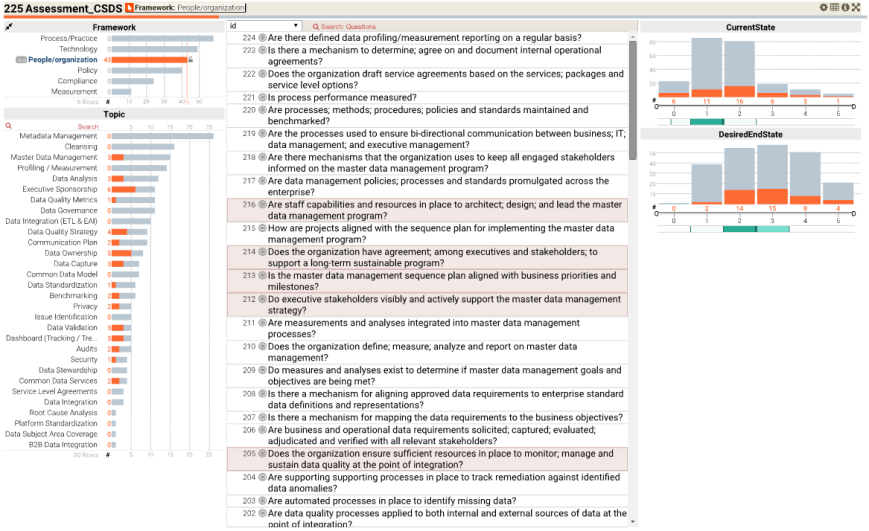
This is a quick way to summarize our findings and give valuable clues and direction for further investigation. We can then focus on specific problem areas using detailed schedules based on the field work to date. Based on the gaps uncovered at the higher level summary (Current vs. Desired End State) further investigation should be performed by a professional with deep subject matter expertise and intimate knowledge of generally accepted proven practice. Using the same data set we can now begin to use an interactive exploration tools to uncover significant patterns and reveal further insight.

MDM_Explore_2


Results
I hope this has helped readers who have asked about how to develop and use gap analysis tools to find quickly what significant delta items (the difference between current and desired states) demand further attention. I think you can see this is valuable way to quickly gather, compile field work, and capture a fairly comprehensive view of the gaps uncovered between the current and desired end state of the subject in question. This method and set of tools can be used in a variety of management challenges across the business both big and small. Armed with this information we can now go ahead to step four (4) and begin to prioritize the findings from the Gap Analysis exercise into a series of gap closure strategies.

This is an invaluable way to assemble and discover the best sequence of actions (recognizing predecessor – successor relationships) as we move to developing the road map. This difference (delta) between these two (current and desired end state) is the basis for our road map. I hope this has answered many of the questions about step three (3) Conduct a Gap Analysis exercise. This is not the only way to do this, but has become the most consistent and repeatable methods I’m aware of to perform a gap analysis quickly in my practice.


If you enjoyed this post, please share with anyone who may help from reading it. And don’t forget to click the follow button to be sure you don’t miss future posts. Planning on compiling all the materials and tools used in this series in one place, still unsure of what form and content would be the best for your professional use.Please take a few minutes and let me know what form and format you would find most valuable.

Suggested content for premium subscribers:

  • Topic Area Models (for use with Mind Jet – see https://www.mindjet.com/ for more)
  • Master Data Management Gap Analysis Assessment
  • Data Maturity Management Capability Assessment
  • Analytic Practice Gap Analysis Assessment
  • Big Data Analytic Gap Analysis Assessment
  • Program Gap Analysis Assessment
  • Program Readiness Assessment
  • Project Gap Analysis Assessment
  • Enterprise Analytic Mind Map
  • Reference Library with Supporting Documents

Big Data Analytics – Unlock Breakthrough Results: (Step 5)

The Analytic User Profile
PeopleOutLineUnderstanding that form follows function we are now going to develop one of the most important interim products for our decision model; the analytic user profile. A profile is a way of classifying and grouping what the user community is actually doing with the analytic information and services produced. This step will develop a quantified view of our user community so we can evaluate each platform or tool for optimization quickly and produce meaningful results aligned with usage patterns. We already know that one size does not fit all (see Big Data Analytics and Cheap Suits). Selecting the right platform for the right job is important to success. This step will attempt to quantify a couple of key data points we can use to:

  • distinguish actual usage patterns (e.g. casual users from power users)
  • match resulting profiles to platform capability
  • match resulting profiles to tool categories
  • gain a deeper understanding of what the community of producers and consumers really needs.

Along the way we are going to explore a couple of different approaches used to solve for this important insight.

What is an Analytic User Profile?
A user profile is a way of classifying and grouping what the community is actually doing with the analytic information being produced and consumed. This can expressed with a simple diagram below. Note that typically 80% of the work is usually associated with review and retrieval of data using a descriptive or diagnostic analytic. The other 20% is related to the use of sophisticated predictive and prescriptive analytics used to augment the transaction data gathered and distributed for operational support. In what is now being labeled Big Data 3.0 analytic services are now being embedded into decision and operational processes, in effect combining analytic styles in ways that were just not possible a few years ago.

HighLevelDistributionNow we have a high level view of what is being done, who is doing this? There are several ways to classify and categorize roles or signatures. For example the diagram above includes terms like Miners, Explorers, and Gatherers (see the bottom axis for the labels). The following diagram illustrates another way to view this community using many of the same classification labels.

HighLevelDistribution_02

Of course you can refine this to any level of granularity you are comfortable with preserving the integrity of the classification. By that I mean preserving the function and not mixing form (like an organizational role as opposed to function). If you look at the diagram closely you will notice this diagram uses organizational roles and not functions like the first diagram. Use one or the other, but do not mix at your own peril. They mean very different things. There is no reason you can’t map one to the other and vice versa when needed.

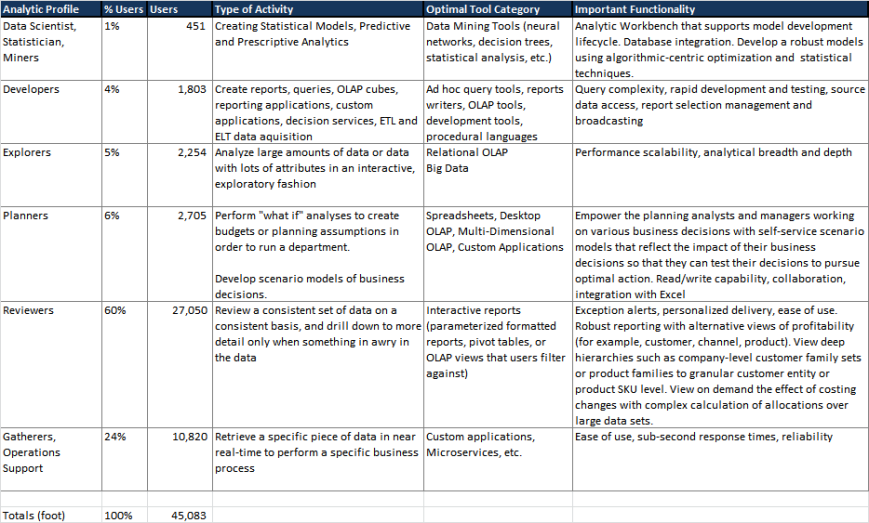
Here is a table illustrating the analytic profile I use. Not perfect, but has served me well. This table includes the type of activity, optimal tool usage, and important functionality associated with each profile.ProfileTypes_01

Form Follows Function – An Example
Think it be helpful to illustrate these abstract concepts with a real example. In this case we will use the concept of form following function by examining what kind of questions and answers are typically developed when measuring retail conversion rates (similar to digital channel conversion rates). This diagram illustrates the types of questions typically asked and the necessary analysis required to answer them. Note, as analytic capability matures two things occur, the questions become more predictive focused and the systems to answer them become more complex.
ConversionRate_Example_01Now here is the same diagram overlaid with the typical tools used to solve for and answer each important question.

ConversionRate_Example_02

Do you see what is missing? The analytic profile or type of user for each question and each answer is not present. Think carefully about which profile or role would ask the question and which would give the answer. It should be clear that answering a predictive or prescriptive question about optimization requires a very set of skills and tools than just rendering the results in a reporting platform or mobile device. And who and how many are categorized in each group? This is the next step.

Completing the Analytic User Profile
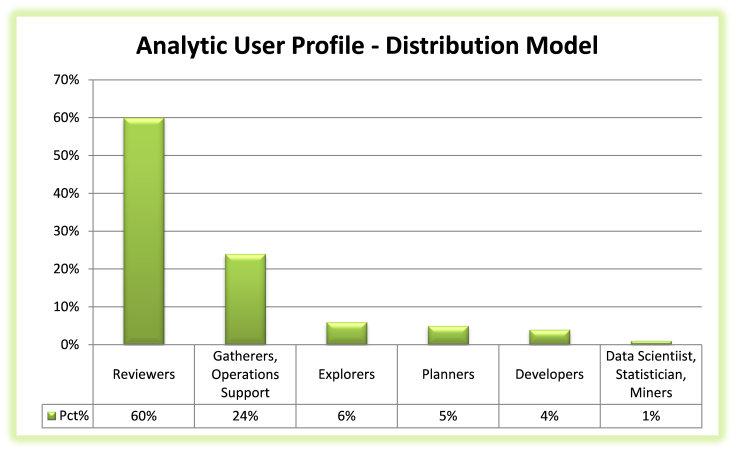
Now we have a good idea of the kinds of questions and answers we may find it is time to prepare a quick census. This is not a precision exercise rather one of just understanding the relative size and number of each profile found within the analytic and consuming community. There are several advanced statistical methods available to you if more precision (and the data is available) is needed. For a quick way to estimate these values I will share one method that works well enough for me. Recall the relative distribution of profiles can be modeled to look something like the distribution of analytic profiles found in the following diagram.

DistributionChartUsing simple mathematics we can perform a simple calculation to approximate missing values where we know one value in the data; if know there are 600 reviewers based on the number of distinct logins captured and normalized over a suitable time frame (assuming a normal distribution) across reporting platforms then we can expect the total community to number around 1,000 (600/.60 = 2,000). In this population using the model we can expect to find:

  • 10 Data Scientists, Statisticians, and Miners creating statistical models using predictive and prescriptive analytics, sourced from internal and external data
  • 40 Developers creating and maintaining reports, queries, OLAP cubes, reporting applications
  • 50 Explorers analyze large amounts of data in an interactive, exploratory fashion
  • 60 Planners performing “what if” analyses to create budgets or planning assumptions
  • 600 Reviewers (known value) looking over a consistent set of data on a consistent basis (reporting), and drilling down to more detail only when something in awry in the data
  • 240 Gatherers and Operations support professionals retrieving a specific piece of data in near real-time to perform a specific business process

Here is an actual sample of field-work completed using this method where the number of distinct log-ins across reporting platforms (27,050) was known and almost all log-ins could be classified and grouped as Reviewers. Note this is an approximation due to proxy or application identifier use, but it is good enough for now. This is a large organization and reflects a certain economies of scale. Your distribution model may not reflect this capability and may need to be adjusted.

Populated_Table_02

Before you begin to question the accuracy and completeness of this exercise (and you should) note this work product only represents a quick rule of thumb or starting position. The results should be validated and confirmed or disproved with a more rigorous examination with the stakeholders. And of course the distribution model of the analytic profiles may be different based on your industry or line of business. This is quick. And only required one confirmed data point and a week of follow-up and confirmation within the organization.

If you have the time and need more precision (including a more sophisticated statistical analysis) there is always the tried and true field work option to collect more data points. This is usually performed as follows.

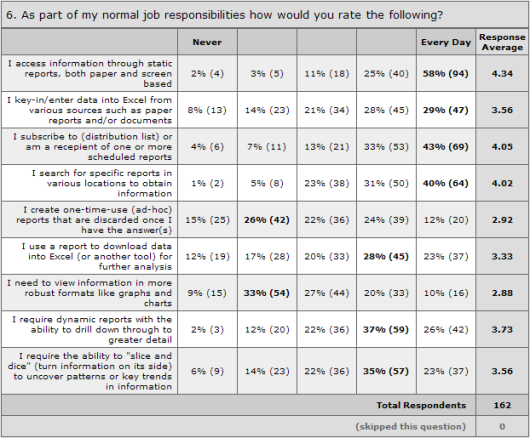
  1. Prepare profile census values and questionnaires. Develop the questions of the survey in general non-technical QuestionImageterms so that it could be understood by business users. Target a time of no more than 15 minutes to answer the questions. Provide a combination of single choice, multiple choice, rating scales and open ended questions to add variety and get more complete answers.
  2. Prepare and distribute the survey across the organization under examination. Provide an easy to use web-based online survey that can be accessed over the Internet. Email internally to various distribution lists with a URL link to the online survey.
  3. Compile results
  4. Clean or fill missing values using the appropriate algorithmic filters
  5. Test the refined results for validity using sound statistical techniques
  6. Interpret the finding and prepare the data sets for publication
  7. Publish findings for review and comment
  8. Incorporate responses and revise findings to reflect stakeholder comments

If this sounds like a lot of work it is. This field work is not quick and will take months of labor intensive activity to do successfully. The good news is you will have a much more precise insight into the analytic community and what your users are actually doing. Capturing this insight can also give the information on business needs by determining who are using tools, what business questions are being answered using tools, when or how frequent tools are being used, where the tools are being used (against what data sources) and finally to assess how the existing tools are being used.

Summary
Understanding that form follows function, we have now developed one of the most important interim products for our decision model; the analytic user profile. A profile is a way of classifying and grouping what the user community is actually doing with the analytic information and services produced. These profiles can be used to:

  • distinguish actual usage patterns (e.g. casual users from power users)
  • match resulting profiles to platform capability
  • match resulting profiles to tool categories
  • gain a deeper understanding of what the community of producers and consumers really needs.

With a quantified view of the analytic community we can now evaluate each platform or tool for optimization quickly and produce meaningful results that are aligned with usage patterns in the upcoming decision model.


If you enjoyed this post, please share with anyone who may benefit from reading it. And don’t forget to click the follow button to be sure you don’t miss future posts. Planning on compiling all the materials and tools used in this series in one place, still unsure of what form and content would be the best for your professional use. Please take a few minutes and let me know what form and format you would find most valuable.
Suggested content for premium subscribers:
Operating Model Mind Map (for use with Mind Jet – see https://www.mindjet.com/ for more)
Analytic Core Capability Mind Map
Analytic User Profile workbooks
Enterprise Analytics Mind Map
Reference Library with Supporting Documents

Prior Posts in this series can be found at:
Big Data Analytics – Nine Easy Steps to Unlock Breakthrough Results
Big Data Analytics – Unlock Breakthrough Results: (Step 1)
Big Data Analytics – Unlock Breakthrough Results: (Step 2)
Big Data Analytics – Unlock Breakthrough Results: (Step 3)
Big Data Analytics – Unlock Breakthrough Results: (Step 4)

Eight powerful secrets for retaining delighted clients

Eight powerful secrets for retaining delighted clients
(What they don’t teach you in business school)

Success-Secrets-1Over the years I have come to believe there are few simple secrets to my consulting success with several organizations both large and small. These secrets are not taught in business schools. And it seems the larger firms have stopped investing in helping younger professional learn the craft and soft skills needed. Many of these tips are just common sense and represent proven practice. You can always choose to ignore one or more of them and expect a client experience that is less than expected. I do think carefully about each one of them now in every engagement. They have served me well. Think you will them invaluable in your professional life as well.

1) Help them listen to themselves
The golden rule of any client communication is to listen. Once you are done listening, repeat or paraphrase what you have heard. Helping a client hear what they’ve just said is invaluable. Not only does it ensure you haven’t misinterpreted anything, hearing their thoughts explained by someone else often highlights potential issues. It is always better for the client to recognize problems themselves instead having to point them out.

2) Never ignore or reject a bad idea
When the client says ‘my idea is to …’ avoid the instinct to point out why the hilariously awful suggestion won’t work. Instead, listen, take notes and say something like ‘I will take that into consideration’. When returning with your much better ideas, they probably won’t mention it again. If they do, just say it didn’t quite work. They’re usually happy that you will have considered this and are truly receptive to their ideas. No matter how bad.

3) You can have it cheap, fast or good. Pick any two.
Explain the two out of three rule. All clients will always want you to produce distinctive, high quality work in less than a week for next-to-no money. But they sometimes forget that these things come at a price, and their reluctance to pay your rates or pressure to work faster can make you question your own reasoning. The most demanding won’t even understand why it’s not possible. Help them to understand by explaining the ‘two out of three’ rule:

Good Distinctive Quality + Fast = Expensive
You will defer every other unrelated job, cancel all un-necessary tasks and put in ungodly hours just to get the job done. But, don’t expect it to be cheap.

Good Distinctive Quality + Cheap = Slow
Will do a great job for a discounted price, but be patient until we have a free moment from pressing and better paying clients.

Fast + Cheap = Inferior Quality
Expect an inferior job delivered on time. You truly get what you pay for, and in our opinion this is the least favorable choice of the three. In most cases I decline or disengage rather than commit to something that may result in damaging the relationship. See secret 5 about never presenting ideas you don’t believe in and who can believe in junk?

To summarize: You can have it cheap, fast or good. Pick any two and meet everyone’s expectations.

4) Don’t make delivery promises straight away
Clients want immediate delivery date commitments. As much as you would like to conclude meetings with a firm, ‘yes I can’, always check with your team first or just ask for some time to ensure you have thought about the commitment thoughtfully. Not only does this show you take deadlines seriously, the next time the same client rings with an urgent request, you can buy time before committing. It is remarkable how many must-have-it-yesterday emergencies can fix themselves or simply melt away within hours of the initial request. A commitment is a promise. When you break a promise, no matter how small it may seem to you it can damage the client relationship and your reputation (brand).

5) Never present ideas you don’t believe in (no junk please!)
It’s tempting when preparing solution options to add one more into the mix. I guess we sometimes think that including a Junknot-so-great idea highlights the effort we put into the preferred option and will make our other suggestions look even stronger. But what if the client picks the wrong option? Then you are stuck producing your own dumb idea you simply don’t believe in. If your main ideas are good enough, that’s all you should need. If the client hates them, you can always fall back on the rejects or junk if needed.

6) Don’t assume you’ll find ‘it’ alone
You worked on presenting your ideas alone with little time for collaboration. Looks great to you – what a genius you are. And then client see this and says I’ll know it when I see it and this is not what I expected’. These are the words that you never want hear as a creative, hard-working professional. You have no found it. If a client doesn’t like your ideas but can’t explain why, never assume that you can hit the mark next time. The client not knowing what they want is your problem so spend more time with them exploring other work they like. This helps get inside their heads and closer to finding the elusive ‘it’.

7) Who actually has final approval?
The final seal of approval may not come from the person you deal with every day. Managers have Directors, Directors have VPs, and VPs have a C-level they report to. So always uncover exactly who is the ultimate authority before proceeding with your ideas. Most people usually hate showing rough sketches to their boss, meaning you need to flesh out one or two elements in advance (see the secret number 6) with your client. Ensuring your work avoids a last minute thumbs-down is worth the time and effort.

8) If all else fails, raise your rates
Most clients are a joy to work with. Hopefully these secrets will help you deal with the most challenging parts of the creative process and leave you with a delighted client. But sometimes, you just know deep down someone is going to be impossible to work with. And you will know this quickly. If simply turning down the work is not an option or will create a poor perception with the client, raise your rates by 20%. At least then you can console yourself with cash during another long weekend of last minute revisions, rework, and unnecessary stress. And what about that time forever lost to your family and loved ones? This is a trap; the higher rate is almost never worth the cost to your nervous system. Manage your time wisely, it truly “is never found again”.

19017dgvl2m2ajpg

The Holiday Message

Steve-Jobs-Secret-of-LifeIt is a new year, plenty of self-help and inspirational stories are available and the resolutions we have all made that will last about another week or two. And some are based on some inspirational thoughts from Einstein to Aristotle to Jobs, and more. Of course others are less revealing and downright confusing or just plain silly. We all struggle with this (what is real and what is just fluff) from time to time.

And then it happens. While pulling down the lights and placing the holiday decorations back in their boxes your child comes to you and asks you what to do, how to succeed where others have not and what is the difference between success and everything else. What? So, how to respond? This is serious business, no time to make light of the circumstances or blow off another conversation that always seems to end unresolved. My child is seeking knowledge and I’m now committed to deliver something worthwhile. He really wants to know. Even with all the chaos around us.

And this is where it gets interesting. I try with a simple exposition on focus and it’s importance to everything worthwhile in life. Then I get the inevitable follow-up. What is focus? And then it hits me in an unplanned moment of clarity I can’t explain. Focus means you have to do the hard things. Doing what no one else is doing. Maybe doing what scares you. The things that make you wonder how much longer you can hold on. Those are the things that define you. Those are the things that make the difference between living a life of mediocrity or outrageous success. Pressed for more, I have to respond with the following:

  • Make the call you’re afraid to make.
  • Get up earlier than you want to get up.
  • Give more than you get in return right away always. Care more about others than they care about you.
  • Feel unsure and insecure when playing it safe seems smarter – it will all be work out.
  • You have to lead when no one else is following you yet.
  • Invest in yourself even though no one else is – what do they know?
  • Prepare to look like a fool while you’re looking for answers you don’t have.
  • Deliver results when making excuses is an option – this is really not an option.
  • Search for your own explanations even when you’re told to accept the “facts.”
  • Make mistakes and look like an idiot – this is not the end of the world.
  • Try and fail and try again. Fail forward…
  • Be kind to people who have been cruel to you – they don’t know any better.
  • Be accountable for your actions even when things go wrong.

TheRoadAhead_ChildThe hard things are the easiest things to avoid. To pretend like they don’t apply to you is just not true. The simple truth about how ordinary people like us is to accomplish outrageous feats of success is to do the hard things that smarter, more qualified people don’t have the courage — or desperation — to do. And perhaps the most poignant expression we can learn from Steve Jobs:


“Remembering that I’ll be dead soon is the most important tool I’ve ever encountered to help me make the big choices in life. Because almost everything — all external expectations, all pride, all fear of embarrassment or failure – these things just fall away in the face of death, leaving only what is truly important.”

Yes this is true, now everything is packed away carefully for next year and to my son I can only hope I have passed the audition; and you have come to realize something for yourself reading this.

Big Data Analytics – Unlock Breakthrough Results: (Step 4)

wieghted_foodIn this step we look a little closer into defining the critical capabilities used across the four operating models discussed in an earlier post (Big Data Analytics – Unlock Breakthrough Results: Step 3). We are going to assign relative weights to each of the critical capabilities groups for each operating model uncovered earlier. This is done to assign the higher weighting to capability groupings most important to the success of each model. Having the quantified index means we can evaluate each platform or tool for optimization within quickly and produce meaningful results. We already know a set of tools and platforms which are ideal for Centralized Provisioning are usually unsuited for use within a Decentralized Analytics operating model. In contrast critical capability essential to Embedded Analytics is very different from Governed Data Discovery. Yes there are some capabilities that cross operating models (e.g. metadata), and some that are far important than others. So what we are doing in this step is just gathering and validating the relative importance of each so form truly does follow function. This will become increasingly clear when building the decision models to guide our actions.

What is a decision model?
A Decision Model is a new way of looking at analytics using business logic. A key enabler sandwiched between BPM and Business Rules, the logic is captured and knits both together to illustrate what drives the decisions in a business. Instead of trying to capture and manage the logic one business rule at a time, a Decision Model groups the information sources, knowledge, and decisions (including the rules) into their natural logical groups to create the structure that make the model so simple to capture, understand, communicate and manage. Using this method we will be using a proven approach for OMG_DMN_Imagesolving platform and tool optimization in the same way that proven practice suggests every analytic decision be made. DMN provides the constructs that are needed to model decisions, so that organizational decision-making can be readily depicted in diagrams, accurately defined by business analysts, and optionally use to specify and deploy automated decision-making. The objective is to illustrate a method to address the perplexing management challenge of platform and tool optimization. In this step we are simply using an organizing principle to continue grouping and categorizing our findings quantifying each capability in its complexity and nuance across several facets. For more on this see the OMG specification released in September 2015.

Relative Weights
The relative weights and further refinements should reflect your site specific needs so there is less of chance of friction or semantical confusion when the decision model and the findings are shared with the stakeholders. This is a collaborative exercise where the findings are shared and confirmed with both technical and business stakeholders for agreement and validation. This usually means you (as an architect) create the baseline and then iteratively refine with the subject matter experts and business sponsors to agree on the final results or weights that will be used. This work still remains platform, tool, and vendor agnostic. We are simply trying to identify and assign quantitative measures to evaluate which functional (critical capability) is most important to each operating model. A good baseline to begin with is the Gartner work published as Critical Capabilities for Business Intelligence and Analytics Platforms this summer (12 May 2015 ID:G00270381). With this we have a reasonably good way to think about form and function across the different operating models which Gartner refers to in their work as baseline use cases. Recall that across any analytic landscape (including big data) we are most likely to encounter one or more of the four operating models to include:

– Centralized Provisioning,
– Decentralized Analytics,
– Governed Data Discovery, and
– OEM/Embedded Analytics.

This seems to be a sensible way to organize the decision model we building. Thanks to Gartner we also have a pretty good way to describe manage the fifteen (15) groups of critical capabilities to use when comparing or seeking platform and tool optimization within each model. The baseline used includes the following groups of features, functions, and enabling tools:

– Traditional Styles of Analysis
– Analytic Dashboards and Content
– IT-Developed Reports and Dashboards
– Platform Administration
– Metadata Management
– Business User Data Mash-up
– Cloud Deployment
– Collaboration and Social Integration
– Customer Services
– Development and Integration
– Ease of Use
– Embedded Analytics
– Free Form Interactive Exploration
– Internal Platform Integration
– Mobile

The purpose in all of this is arrive at some way to quantify which capability within each operating model is more important than the others; weighting their relative importance in satisfying need. In this step we are simply starting at a baseline. We can refine the critical analytic capabilities from this baseline to meet site specific needs before moving on to the weighting in the next step. Note these are high level summary weights. Each capability includes a number of different values or characteristics you can refine to any level of detail you believe necessary. They should all sum to the groups value (e.g. 20% for Platform Administration within the Centralized Provisioning model for example) to retain the integrity of the results.

For each of the fifteen (15) groups of critical capabilities we assign weights to be used in later steps to evaluate the relative importance of each within each operating model.

ExcelCriticalCapabilityWeights

Note: the weights used in this example are based on the Gartner work referred to above. I have changed the metadata weighting to reflect my experience, leave the balance of the work to the next step after you have tailored this baseline to your environment and are ready to apply your own weighting.

We have already seen there are very different needs required for each of the models presented. As the decision model is introduced and developed the data points for each can be used to develop quick snapshots and quantitative indexes when evaluating the form and function for each optimization in question.

Summary
The fifteen (15) critical capabilities are now assigned relative weights used within each of the four operating models. We are now at a point where the analytic community profiles can be compiled to arrive at a defensible approach to quantifying the data used in the upcoming decision model. This has also helped clarify and understand the key capabilities that drive each operating model which we see can be very different as illustrated in the following diagram.

RelativeWeightsChart

If you enjoyed this post, please share with anyone who may benefit from reading it. And don’t forget to click the follow button to be sure you don’t miss future posts. Planning on compiling all the materials and tools used in this series in one place, still unsure of what form and content would be the best for your professional use. Please take a few minutes and let me know what form and format you would find most valuable.

Suggested content for premium subscribers:
Big Data Analytics – Unlock Breakthrough Results: Step Four (4)
Operating Model Mind Map (for use with Mind Jet – see https://www.mindjet.com/ for more)
Analytic Core Capability Mind Map
Enterprise Analytics Mind Map
Analytics Critical Capability Workbooks
Analytics Critical Capability Glossary, detailed descriptions, and cross-reference
Reference Library with Supporting Documents
Prior Posts in this series can be found at: