
In this step I will dive deeper into defining the critical capabilities used across the four operating models discussed in an earlier post (Big Data Analytics – Unlock Breakthrough Results: Step 2). This may be a little boring for many and just a little too detailed for a medium like this. I believe it is important to always define your terms and create a controlled vocabulary so there is less of chance of friction or ambiguity in the decision model we will be developing. Seems old-fashioned and little of date in a world where Info-graphics and sound-bites are the preferred delivery medium. So at the risk of boring many, I’m going to just put this baseline out there and reference this work later when needed.
Capability Defined
A capability is the ability to perform or achieve certain actions or outcomes through a set of controllable and measurable faculties, features, functions, processes, or services. Capability describes “the what” of the activity, but not necessarily the how. Achieving success with big data means leveraging its’ capability to transform raw data into the intelligence to realize true actionable insight. Big data is a part of a much larger ecosystem and should not be viewed as a stand-alone solution that is independent of the other platforms available to the analytic community. The other platforms should be used to expand and amplify what is uncovered in big data using each of their respective strengths.
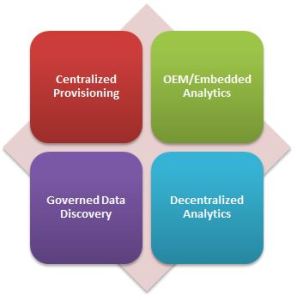 Thanks to Gartner who published Critical Capabilities for Business Intelligence and Analytics Platforms this summer (12 May 2015 ID:G00270381) we have a reasonably good way to think about form and function across the different operating models which Gartner refers to in their work as baseline use cases. Recall that across any analytic landscape (including big data) we are most likely to encounter one or more of the four operating models to include:
– Centralized Provisioning,
– Decentralized Analytics,
– Governed Data Discovery, and
– OEM/Embedded Analytics.
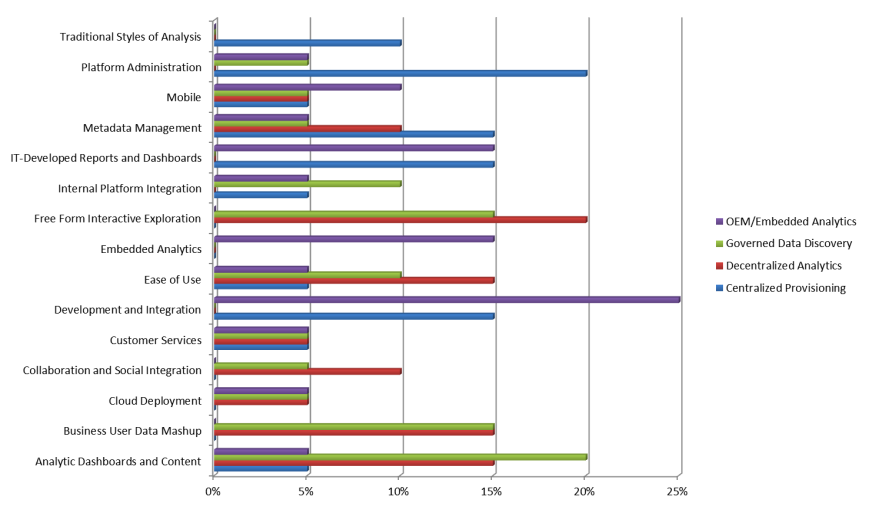
This seems to be a sensible way to organize the decision model by describing the fifteen (15) groups of critical capabilities when comparing or seeking platform and tool optimization. The baseline used includes the following capability groups:
– Traditional Styles of Analysis
– Analytic Dashboards and Content
– IT-Developed Reports and Dashboards
– Platform Administration
– Metadata Management
– Business User Data Mash-up
– Cloud Deployment
– Collaboration and Social Integration
– Customer Service
– Development and Integration
– Ease of Use
– Embedded Analytics
– Free Form Interactive Exploration
– Internal Platform Integration
– Mobile
There are other ways to view capability. See Critical Capabilities for Enterprise Data Science written by Dr. Jerry Smith that addresses Data Science in depth. His work represents a significant deep dive into the data science and a refinement of capability expressed at a much more granular level than I suggest here. The purpose in this effort is to organize and quantify which capability within each operating model is more important than the others; weighting their relative importance in satisfying need. In this step we are simply starting a baseline. We can refine the critical analytic capabilities from this baseline to meet site specific needs before moving on to the weighting in the next step.
Note: the weights used in this example are based on the Gartner work referred to above. I have changed the metadata weighting to reflect my experience, will leave the balance of the work to the next step after you have tailored this baseline to your environment and are ready to apply your own weightings.
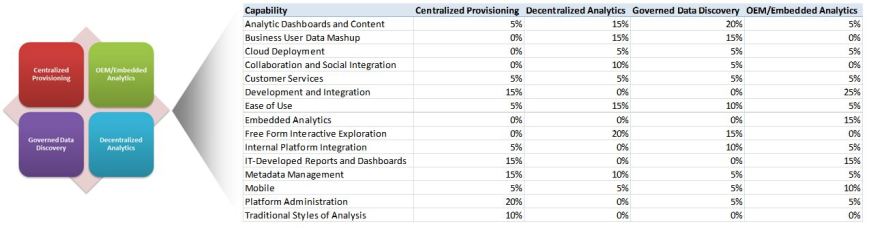
We have already seen there are very different needs required for each of the models presented. A set of tools and platforms which are ideal for Centralized Provisioning may be completely unsuited for use within a Decentralized operating model. Critical capability essential to Embedded Analytic is very different from Governed Data Discovery. And of course there are some essential capabilities that will be shared across all operating models (e.g. metadata).
As the decision model is introduced and developed in later steps the data points for each can be used to develop quick snapshots and quantitative indexes when evaluating for form and function. I know this seems like a lot of work. Once completed you can always leverage this effort for solving for what can seem like bewildering array of choices and implications. Think of this as a way to introduce a taxonomy and a controlled vocabulary so all interested stakeholders have a way to discuss and think about each choice in a meaningful way. The following descriptions and characteristics of each of the fourteen (14) critical capabilities are presented to add additional context.
IT-Developed Reports and Dashboards
Provides the ability to create highly formatted, print-ready and interactive reports, with or without parameters. IT-authored or centrally authored dashboards are a style of reporting that graphically depicts performance measures. This includes the ability to publish multi-object, linked reports and parameters with intuitive and interactive displays; dashboards often employ visualization components such as gauges, sliders, check boxes and maps, and are often used to show the actual 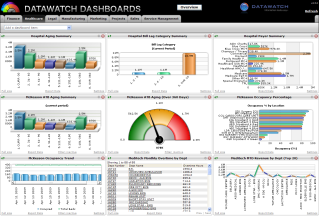 value of the measure compared with a goal or target value. Dashboards can represent operational or strategic information. Most often found in the Centralized Provisioning and OEM/Embedded Analytic models. Key characteristics and functions to recognize include:
– Production reporting, distribution and printing
– Parameterization, filters, prompts
– Report and dashboard navigation and guided navigation
– Design environment and document layout
– Visual components, such as gauges, sliders, dials, check boxes
Analytic Dashboards and Content
The ability to create highly interactive dashboards and content with visual exploration and embedded advanced and geospatial analytics to be consumed by others. Key features and functions include:
– Information visualizations
– Disconnected exploration
– Embedded advanced analytics
– Geospatial and location intelligence
– Content authoring
– Consumer interactivity and exploration
While this is an important capability found across all operating models, it is most important to Decentralized Analytics and Governed Discovery success.
Traditional Styles of Analysis
Ad hoc query enables users to ask their own questions of the data, without relying on IT to create a report. In particular, the tools must have a reusable semantic layer to enable users to navigate available data sources, predefined metrics, and hierarchies. Online analytical processing (OLAP) enables users to analyze data with fast query and calculation performance, enabling a style of analysis known as “slicing and dicing.” Users are able to navigate multidimensional drill paths. They also have the ability to write-back values to a database for planning and “what if?” modeling. This capability could span a variety of data architectures (such as relational, multidimensional or hybrid) and storage architectures (such as disk-based or in-memory). This capability is most often realized through:
– OLAP, and
– Ad hoc queries.
Most often found in the Centralized Provisioning model, it can be useful in Governed Discovery as well.
Platform Administration
Provides the capability to secure and administer users, scale the platform, optimize performance and ensure high availability and disaster recovery. These capabilities should be common across all platform components. This capability includes:
– Architecture
– Security
– User administration
– Scalability and performance
– High availability and disaster recovery
Almost always found in the Centralized Provisioning and to a lesser extent OEM/Embedded Analytics models.
Business User Data Mashup
“Drag and drop,” user-driven data combination of different sources and the creation of analytic models to include user-defined measures, sets, groups and hierarchies. Advanced capabilities include semantic autodiscovery, intelligent joins, intelligent profiling, hierarchy generation, data lineage and data blending on varied data sources, including multistructured data. Features to identify related to this capability include:
– Business user data mashup and joins
– Business-user-defined calculations, grouping
– Data inference
– Data profiling and enrichment
– Business user data lineage
This capability group is important to Decentralized Analytics and Governed Discovery models.
Cloud Deployment
Platform as a service and analytic application as a service capabilities forbuilding, deploying and managing analytics and analytic applications in the cloud, based on data both in the cloud and on-premises. Expect the following features and functions within this group to include:
– Built-in data management capabilities (including data integration and data warehouse)
– Special-purpose connectors to cloud-based data sources
– Direct connect for both cloud and on-premises data sources (hybrid)
– Packaged content
– Self-service administration
– Self-service elasticity
This capability is most important in Decentralized Analytics, Governed Discovery, and Embedded models.
Collaboration and Social Integration
Enables users to share and discuss information, analysis, analytic content and decisions via discussion threads, chat, annotations and storytelling. Think of this as the communication channel or collaborative workspace. In addition to analytic content and findings look for:
– Story telling
– Discussion threads
– Integration with social platforms
– Timelines
– Sharing and real-time collaboration
This capability is most important to Decentralized Analytics and Governed Discovery models.
Customer Service
Relationships, products and services/programs that enable clients to be successful with the products evaluated. Specifically, this includes the ways customers receive technical support or account support. This can also include ancillary tools, customer support programs (and the quality thereof), availability of user groups, and service-level agreements. Examine the service level agreements (SLAs) and discover what the analytic community is happy with; or not.
This capability is found across all operating models.
Development and Integration
The platform should provide a set of programmatic and visual tools and a development workbench for building reports, dashboards, queries and analysis. It should enable scalable and personalized distribution, scheduling, alerts, and workflow of content and applications via email, to a portal or to mobile devices. It should include the ability to embed and customize analytic platform components in a business process, application or portal.
– External platform integration
– Embedded Analytics
– Support for big data sources (including cloud)
– Developer productivity (APIs, SDKs, versioning, and multi-developer features)
– Scheduling and alerts
– Workflow and events
This group of capabilities is important to Centralized Provisioning and OEM/Embedded Analytics models.
Usability – Ease of Use
This is a combined grouping consisting of product quality, support, availability of skills, user support (which includes training, online videos, online communities and documentation) and migration difficulty. Closely related to Customer Service but different – this is all about the content available to analytic community.
Important across all models especially critical in the success of Decentralized Analytics.
Embedded Analytics
This group of capabilities includes a software developer’s kit with APIs and support for open standards — for creating and modifying analytic content, visualizations and applications, and embedding them into a business process and/or an application or portal. These capabilities can reside outside the application, reusing the analytic infrastructure, but must be easily and seamlessly accessible from inside the application, without forcing users to switch between systems. The capabilities for integrating analytics with the application architecture will enable users to choose where in the business process the analytics should be embedded. Look for:
– Capability for embedding (APIs, open standards, SDKs, component libraries)
– Capability to consume common methods, (ex; Predictive Model Markup Language (PMML) and SAS/R-based models in the metadata layer and in a report object or analysis application.
This capability is important to the success of the OEM/Embedded Analytics model.
Free Form Interactive Exploration
This group of critical capabilities enables the exploration of data, manipulation of chart images, with the color, brightness, size, shape and motion of visual objects representing aspects of the data set being analyzed. This includes an array of visualization options that go beyond those of pie, bar and line charts, including heat and tree maps, geographic maps, scatter plots and other special purpose visuals. These tools enable users to analyze the data by interacting directly with a visual representation of it. What to look for?
– Interactivity and exploration
– User experience
– Information visualizations
– Disconnected exploration
– Search-based data discovery
– Data flow
– Content authoring
– In-memory interactive analysis
This capability is most important to Decentralized Analytics and Governed Discovery models.
Internal Platform Integration
A common look and feel, install, query engine, shared metadata, promotability across all platform components.
– Integration with complementary analytic capabilities
– Ability to promote business-user-generated data mashups to the systems of record
– Common security model and administration application components across the platform
– Integrated semantic/metadata layer
– Integrated and common front-end tools
This capability is most important to Centralized Provisioning, Governed Discovery, and OEM/Embedded Analytic models.
Metadata Management
 Platform and supporting tools used to enable users to leverage the same systems-of-record semantic model and metadata. They should provide a robust and centralized way for administrators to search, capture, store, reuse and publish metadata objects, such as dimensions, hierarchies, measures, performance metrics/KPIs, and report layout objects, parameters and soon. Administrators should have the ability to promote a business user-defined data mashup and metadata to the systems-of-record metadata.
– Promotability
– Data modeling
– Reuse
– Connectivity and data sources
– Data lineage and impact analysis
This capability is most important to Centralized Provisioning, Decentralized Analytics, and Governed Discovery models.
Mobile
Enables organizations to develop and deliver content to mobile devices in a publishing and/or interactive mode, and takes advantage of mobile devices’ native capabilities, such as touchscreen, camera, location awareness and natural-language query.
– Content authoring and information exploration
– Information display, interaction and context awareness
– Multi-device support
– Security and administration
– Offline mode exploration
This capability is important across all operating models.
Summary
So there it is. The fourteen (14) critical capabilities organized as a baseline to be used within each of the four (4) operating models. We are now at a point where the data points can be weighted and combined with the community profiles (this is coming in another step) to arrive at a sound approach to quantifying the data used in the upcoming decision model.
 If you enjoyed this post, please share with anyone who may benefit from reading it. And don’t forget to click the follow button to be sure you don’t miss future posts. Planning on compiling all the materials and tools used in this series in one place, still unsure of what form and content would be the best for your professional use. Please take a few minutes and let me know what form and format you would find most valuable.
Suggested content for premium subscribers:
Big Data Analytics - Unlock Breakthrough Results: Step Three (3)
Operating Model Mind Map (for use with Mind Jet - see https://www.mindjet.com/ for more)
Analytic Core Capability Mind Map
Enterprise Analytics Mind Map
Analytics Critical Capability Workbooks
Analytics Critical Capability Glossary, detailed descriptions, and cross-reference
Logical Data Model (XMI - use with your favorite tool)
Reference Library with Supporting Documents
 In this step we look a little closer into defining the critical capabilities used across the four operating models discussed in an earlier post (Big Data Analytics – Unlock Breakthrough Results: Step 3). We are going to assign relative weights to each of the critical capabilities groups for each operating model uncovered earlier. This is done to assign the higher weighting to capability groupings most important to the success of each model. Having the quantified index means we can evaluate each platform or tool for optimization within quickly and produce meaningful results. We already know a set of tools and platforms which are ideal for Centralized Provisioning are usually unsuited for use within a Decentralized Analytics operating model. In contrast critical capability essential to Embedded Analytics is very different from Governed Data Discovery. Yes there are some capabilities that cross operating models (e.g. metadata), and some that are far important than others. So what we are doing in this step is just gathering and validating the relative importance of each so form truly does follow function. This will become increasingly clear when building the decision models to guide our actions.
 solving platform and tool optimization in the same way that proven practice suggests every analytic decision be made. DMN provides the constructs that are needed to model decisions, so that organizational decision-making can be readily depicted in diagrams, accurately defined by business analysts, and optionally use to specify and deploy automated decision-making. The objective is to illustrate a method to address the perplexing management challenge of platform and tool optimization. In this step we are simply using an organizing principle to continue grouping and categorizing our findings quantifying each capability in its complexity and nuance across several facets. For more on this see the OMG specification released in September 2015.


 This post is part of a larger series to provide a detailed set of steps you can take to unlock breakthrough results in Big Data Analytics. The simple use case used to illustrate this method will address the perplexing management challenge of platform and tool optimization. This step is used to identify the types and nature of the operating models used within the analytic community. I’m using a proven approach for solving platform and tool optimization in the same manner that proven practice suggests every analytic decision be made. Here we are simply using an organizing principle to group and categorize our findings in what can quickly become a bewildering experience (much like herding cats) in its complexity and nuance.
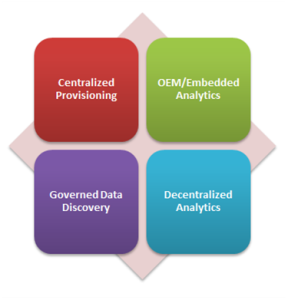 accomplish its function. An operating model breaks this system into components, showing how each works together. It helps us understand the whole. In our case we are going to focus on the analytic community and use this understanding to evaluate fit when making changes to ensure the enabling models will still work after the recommended optimization is called for. Thanks to Gartner who published
 The classic model used for years in delivery of what has been referred to as business intelligence. Typically we would find tight management controls to push through centralized strategy and efficiency, usually at a high cost. Tightly managed processes for collecting and cleaning data before consumption can be found in the classic patterns associated with Extract, Transform, and Load operations into a data warehouse or mart. Most often characterized by formal processes where a developer or specialists collects business requirements from the users and then creates sanctioned reports and dashboards for them on trusted data. Centralized provisioning enables an information consumer to access their
  The opposite of centralized provisioning, this model or loose confederation encourages local optimization and entrepreneurial drive. Look for a community that rapidly and interactively explores trends or detects patterns in data sets often from multiple sources to identify opportunities or risks with minimal support from the IT development community. Interactivity and discovery in this model is NOT limited to what is designed in by the content authors we find in the Centralized Provisioning model. The users are the content authors. Users of platforms and tools that excel at the decentralized analytics model can explore data using highly interactive descriptive analytic (“what happened” or “what is happening”) or diagnostic analytic (“Why did something happen?”, “Where are areas of opportunity or risk?”, and “What if?”). Because of embedded advanced analytic functions offered by many vendors, users can extend their analysis to some advanced descriptive analysis (for example, clustering, segmenting and correlations) and to a basic level of predictive analytic (for example, forecasting and trends). They can also prepare their own data for analysis, reducing their reliance on IT and improving time to insight. As decentralized analytics becomes more pervasive, the risk of multiple sources of the truth and information governance itself becomes a real challenge. Six of fourteen most important capabilities important capabilities needed in this model would include:
 A hybrid of centralized and decentralized this model is best characterized by offering freedom within a framework to enhance transparency and effectiveness. This model features business users’ ability to prepare and combine data, explore and interact visually with this data to enable discovery to be deployed and managed across the enterprise. With the success of data discovery tools in driving business value, there is an increasing demand to use data discovery capabilities for a broader range of analysis and an expanded set of users than previously addressed by traditional reporting and dashboards. Governed data discovery enables users to access, blend and prepare data, then visually explore, find and share patterns with minimal IT support using their own technical and statistical skills. At the same time, this model must also satisfy enterprise requirements for business-user-generated model standards, data reuse and governance. In particular, users should be able to reuse sanctioned and approved business-user-created data or data sets, derived relationships, derived business models, derived KPIs, and metrics that support analyses.
 In this model analytics (decisions, business rules, and processes) are integrated into the organization to capture economies of scale and consistency across planning, operations, and customer experience. Most typically found where developers are using software development kits (SDKs) and related APIs to include advanced analytics and statistical functions within application products. These capabilities are used to create and modify analytic content, visualizations and applications and embed them into a business process, application or portal. Analytic functions can reside outside the application, reusing the infrastructure but should be easily and seamlessly accessible from inside the application, without forcing users to switch between systems. The ability to integrate analytics with the application architecture will enable the analytic community to choose where in the business process the analytics should be embedded. On example of a critical capability for embedding advanced analytics would include consuming a SAS/R or PMML model to create advanced models embedded in dashboards, reports or data discovery views. Six of the fourteen most important capabilities needed in this model would include:


