How to Build a Roadmap – Gap Analysis Update

update-stock-imageI have received a number of requests about the tools and methods used to complete the gap analysis steps from earlier posts in the series How to Build a Roadmap. In this series I have discussed the specific steps required to develop a well thought out road map where one of the key tasks was conducting a gap analysis exercise. Understanding the limits of a medium like this I have posted this update to explore the questions in a little more detail. Believe this will be extremely useful to anyone building a meaningful road map. The internet is full of simply awful templates and tools which range from the downright silly to extremely dangerous in their simple assumptions where there is no attempt to quantify results. Even more distressing is lack of understanding of how to use and leverage the best data sources you already have – the professionals within your own organization. Save yourself some time and read on.

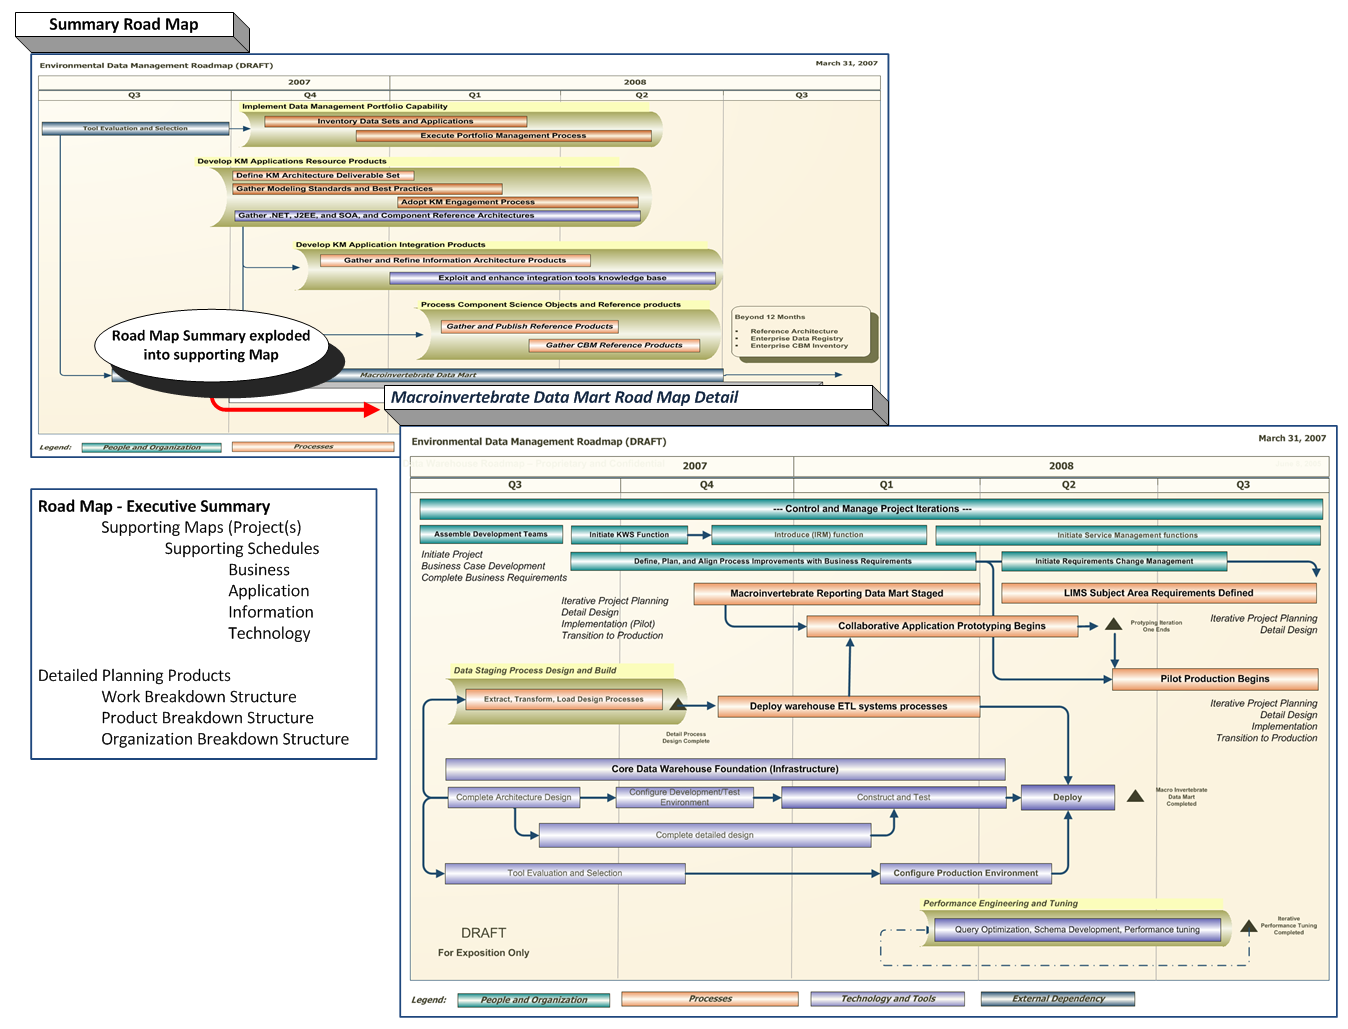
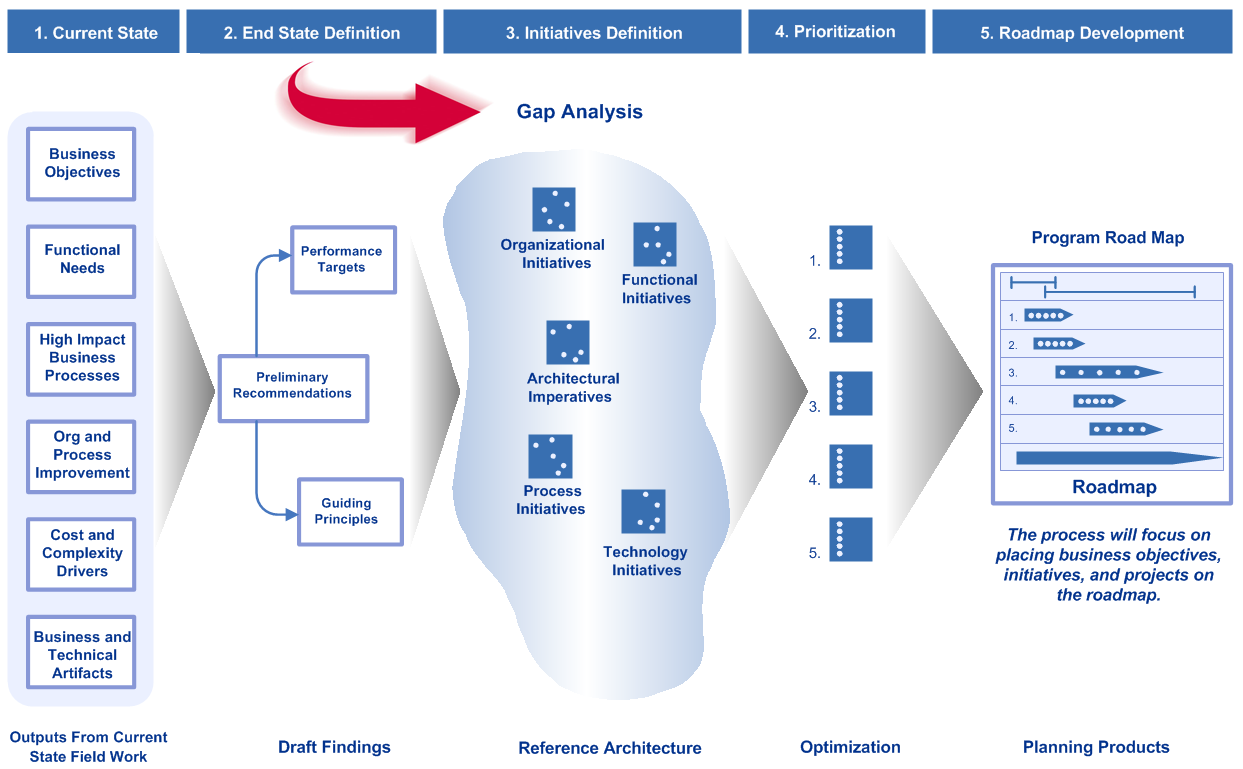
Recall the road map development identified specific actions using an overall pattern ALL road maps should follow. The steps required to complete this work:

  1. Develop a clear and unambiguous understanding of the current state
  2. Define the desired end state
  3. Conduct a Gap Analysis exercise
  4. Prioritize the findings from the Gap Analysis exercise into a series of gap closure strategies
  5. Discover the optimum sequence of actions (recognizing predecessor – successor relationships)
  6. Develop and Publish the Road Map

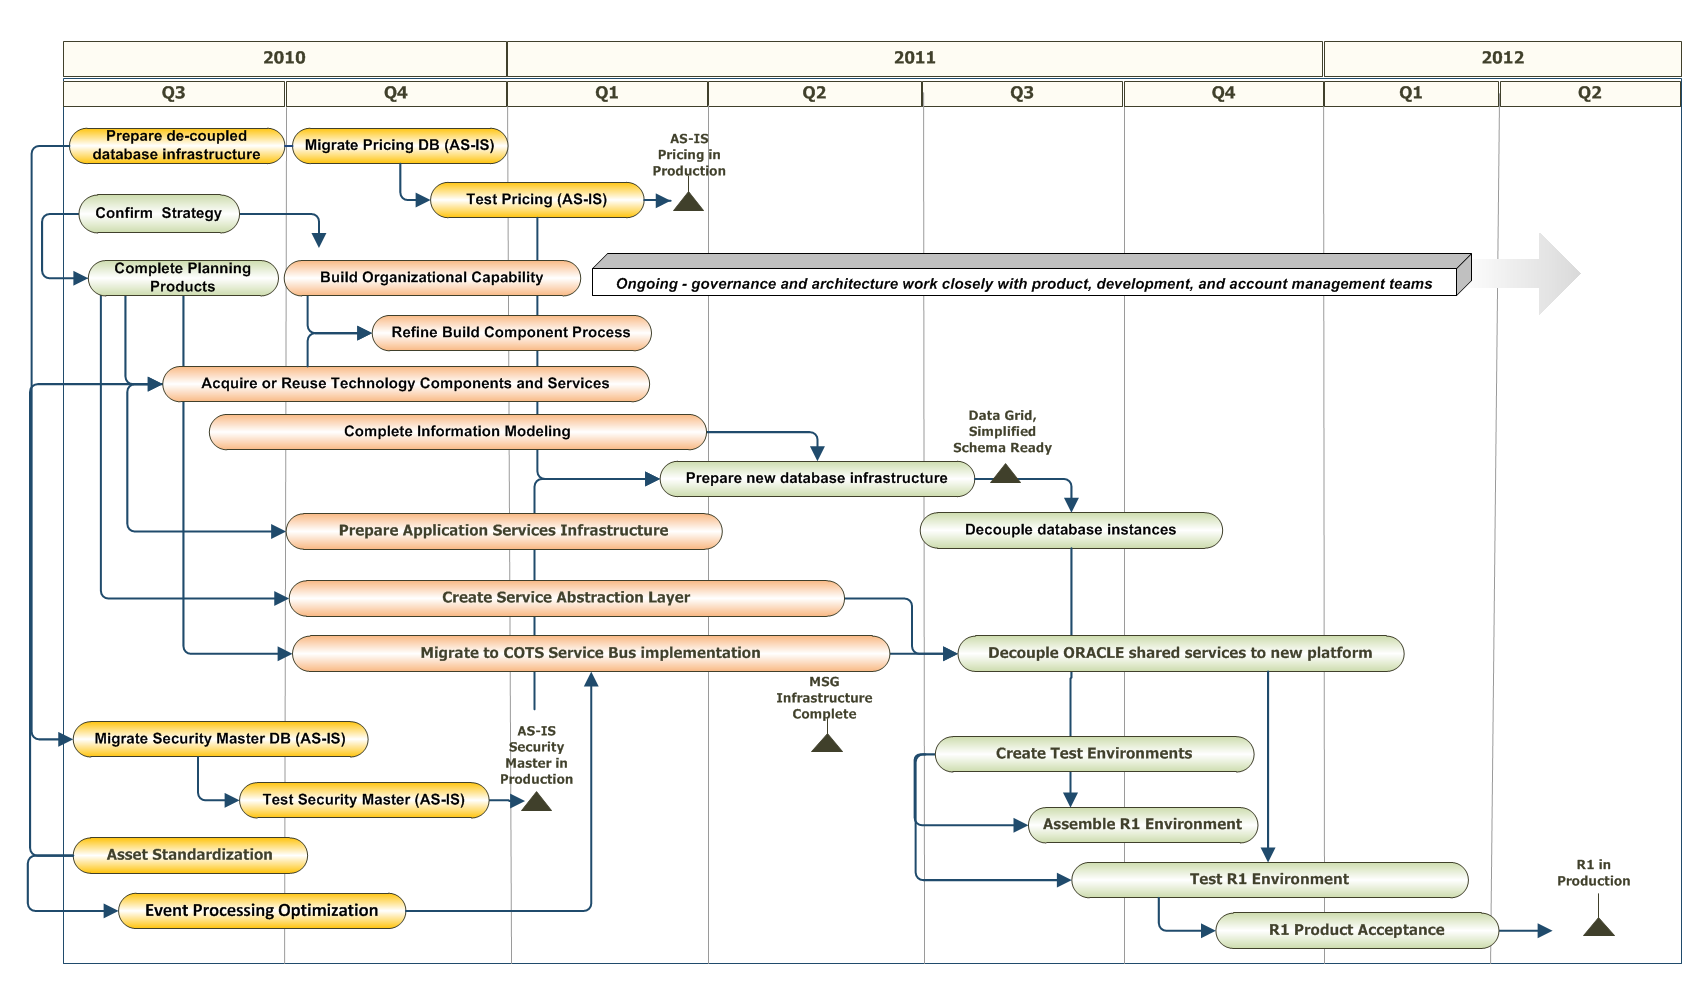
The Gap Analysis step discussed how to develop a robust analytic to find any significant shortcomings between the current and desired end states. We use these findings to begin develop strategy alternatives (and related initiatives) to address what has been uncovered. Our intent is to identify and quantify the difference (delta) from where we are to what we aspire to become. This exercise is critical to find what needs to be accomplished. The gap analysis leads to a well-organized set of alternatives and practical strategies we can use to complete the remaining work. You can review the full post here.

Gap Analysis

Gap Analysis

The goal? Seek a quick and structured way to define actionable activities to be reviewed and approved by all stakeholders. We would like focus on the important actions requiring attention. This includes identifying a set of related organizational, functional, process, and technology initiatives needed. The gap closure recommendations give a clear line of sight back to what needs to be accomplished to close the “delta” or gaps uncovered in the analysis.

What is needed than is a consistent, repeatable way to evaluate quickly where an organization is, where they want to go, and the level of effort needed to accomplish their goals with some precision. In short the delta between current and desired state is uncovered, quantified, and ready for a meaningful road map effort based on factual findings supported by real evidence captured in the field. Performing a successful gap analysis begins with defining what you are analyzing which could be processes, products, a region, or an entire organization. Even at the overall organizational level, knowing what aspect you are analyzing is crucial to find and understand the intent and findings of the effort. Quickly focusing at the desired level of detail means we can now:

  • Know where to go; what really needs attention
  • Pinpoint opportunity…quickly.
  • Uncover what is preventing or holding back an important initiative
  • Know what to do – and in what suggested order

This is where problem solving using some quick management diagnostic tools can be used across a variety of challenges met when developing a road map. Using these tools to perform the gap analysis delivers quick distinctive results and provides the key data and actionable insight needed to develop a meaningful road map. This method (and the tools) can be used to:

  • evaluate capability using a generally accepted maturity model specific to the business,
  • focus on a specific subject area or domain; Master Data Management or Business Intelligence are two examples were known proven practice can be used as starting point to support the findings compiled,
  • assess the readiness of an important program or evaluate why it is in trouble,
  • evaluate and uncover root cause issues with a struggling project,
  • detect and measure what requires immediate attention by uncovering weaknesses where proven practice has not been followed or adopted.

Quick Management diagnostic tools
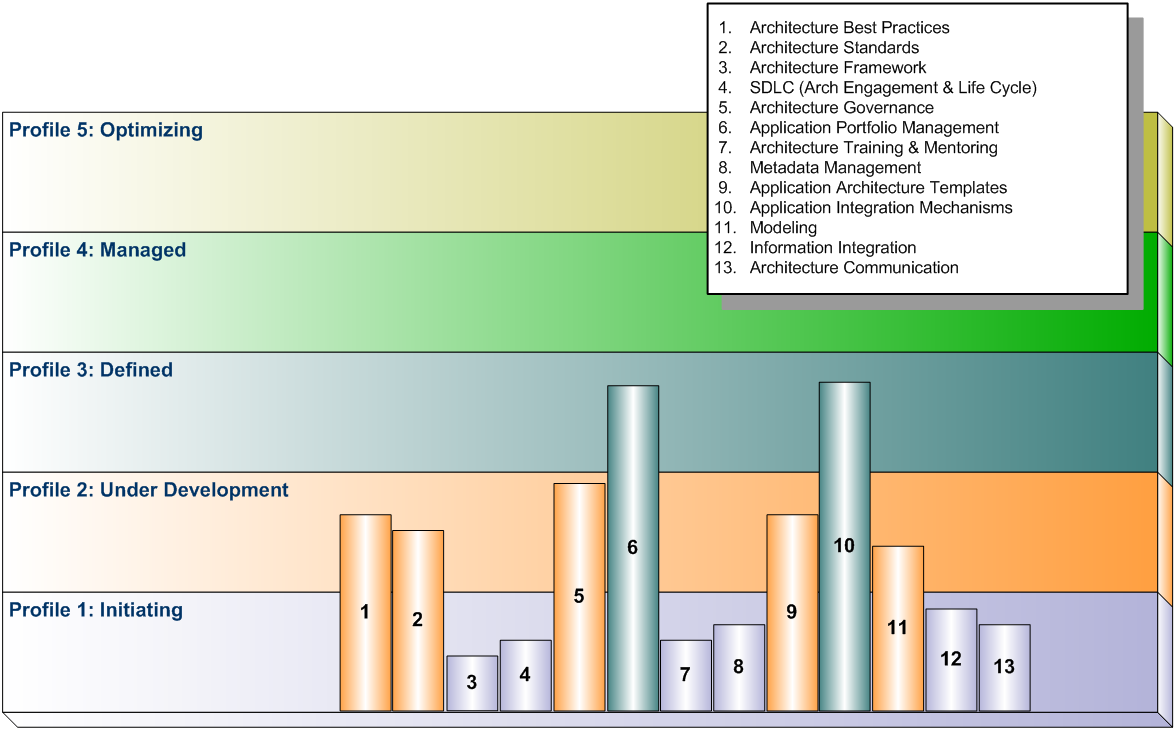
The tool set I use follows the same general pattern and structure, only the content or values differ based on how focused the effort is and what is needed to complete the work successfully. The questions, responses, and data points gathered and compiled are usually organized in a structured taxonomy of topics. See the earlier post (Define End State) for more on this. The key is using the same engine to tabulate values based on responses that can range from zero (0 – Never or No) to five (5 – Always or Yes). Of course you can customize the responses. In fact I have done this with a Program Readiness Assessment and BigData Analytics tool. The real point is to quantify the responses received. The engine component takes the results builds a summary, and produces accompanying tabs where radar graphs plots present the Framework, Topic, Lookup, # Questions, Current State Scores, Desired End State Scores, and common statistical results within each grouping. The tool can be extended to include MS Word document templates which then link to the findings worksheet and grabs the values and charts produced to assemble the draft document ready for further editing and interpretation. If all this sounds confusing, a couple of examples may be helpful.

Using the Data Maturity Model (CMMI) to Evaluate Capability
The Data Maturity Model (DMM) was developed using the principles and structure of CMMI Institute’s Capability Maturity Model Integration (CMMI)—a proven approach to performance improvement and the gold standard for software and systems development for more than 20 years. The DMM model helps organizations become more proficient in managing critical data assets to improve operations, enable analytics and gain competitive advantage.

Using this body of knowledge and a library of source questions we can elicit current state and desired end state responses using a simple survey. This can be conducted online, in workshops, or traditional interviews as needed. The responses are compiled and grouped to evaluate the gap closure opportunities for an organization wishing to improve their data management practices by identifying and taking action to address shortcoming or weaknesses identified. The framework and topic structure of the 142 questions are organized to match the DMM model. DMM_Topics

Looking closer we find the nine (9) questions used to elicit responses related to Business Glossaries within the Data Governance topic.

1) Is there a policy mandating use and reference to the business glossary?
2) How are organization-wide business terms, definitions, and corresponding metadata created, approved, verified, and managed?
3) Is the business glossary promulgated and made accessible to all stakeholders?
4) Are business terms referenced as the first step in the design of application data stores and repositories?
5) Does the organization perform cross-referencing and mapping of business-specific terms (synonyms, business unit glossaries, logical attributes, physical data elements, etc.) to standardized business terms?
6) How is the organization’s business glossary enhanced and maintained to reflect changes and additions?
7) What role does data governance perform in creating, approving, managing, and updating business terms?
8) Is a compliance process implemented to make sure that business units and projects are correctly applying business terms?
9) Does the organization use a defined process for stakeholders to give feedback about business terms?

Responses are expected to include or more of the following values describing current state practice and what the respondent believes is a desired end state. These can simply be a placed on a scale where the following values are recorded for both current and desired outcomes.

Responses
0 – Never or No
1 – Awareness
2 – Occasionally
3 – Often
4 – Usually
5 – Always or Yes

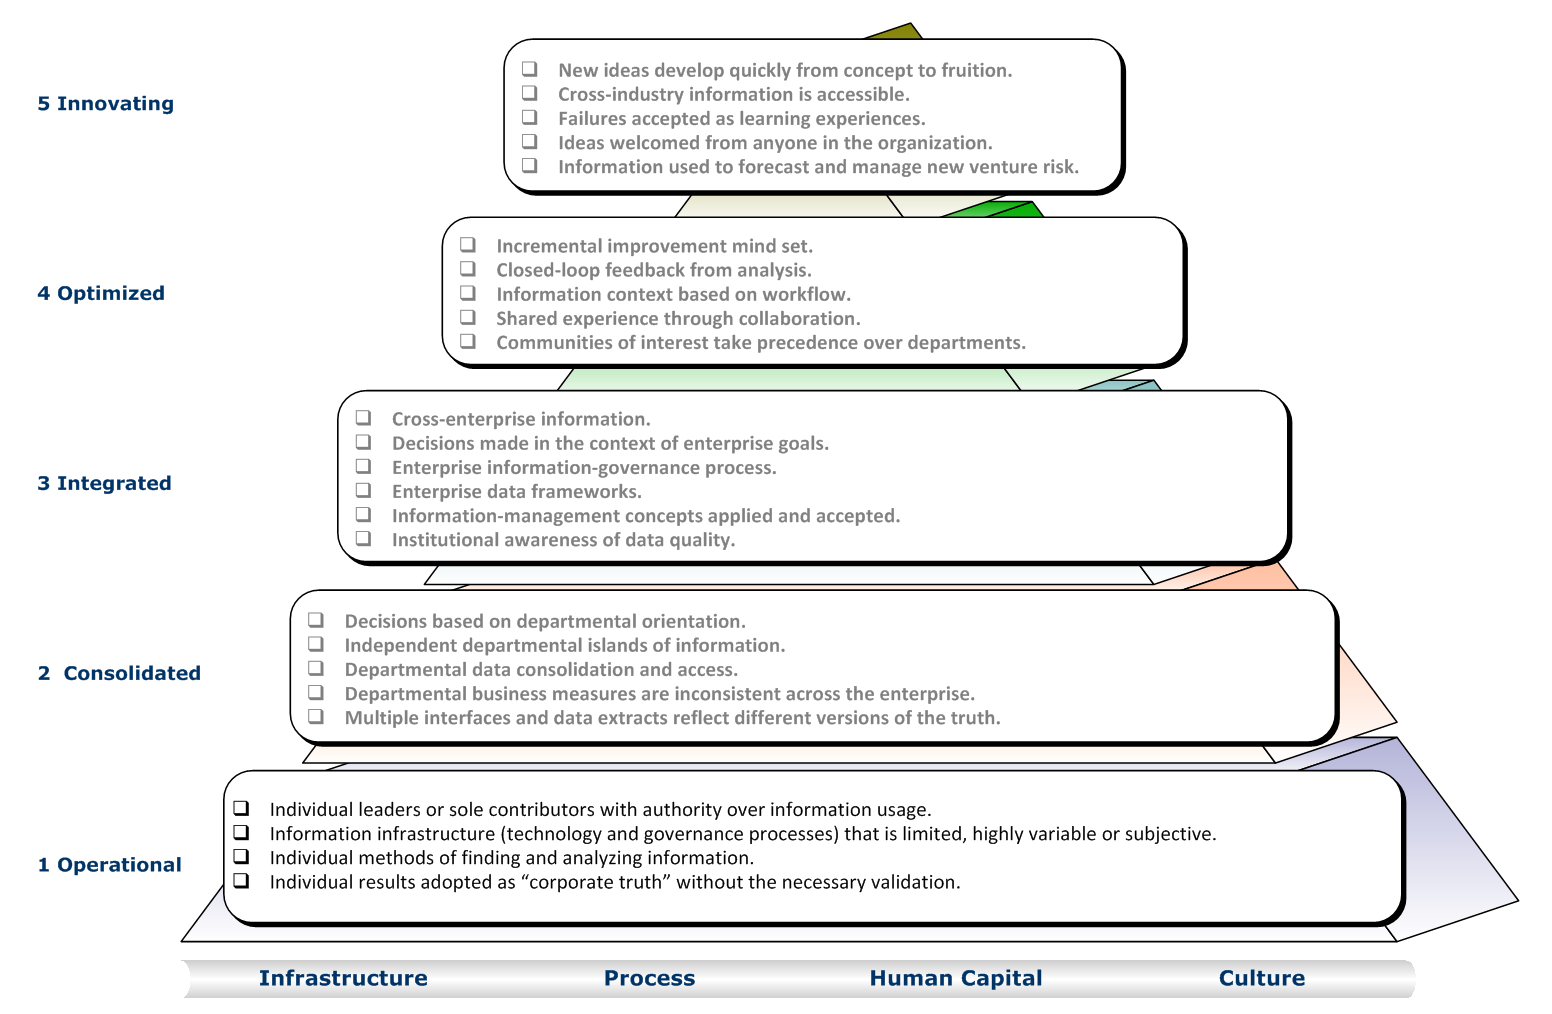
In this example note how the relatively simple response can be mapped directly into the scoring description and perspective the DMM follows.

0 – No evidence of processes performed or unknown response.

1 – Performed Processes are performed ad hoc, primarily at the project level. Processes are typically not applied across business areas. Process discipline is primarily reactive; for example, data quality processes emphasize repair over prevention. Foundational improvements may exist, but improvements are not yet extended within the organization or maintained. Goal: Data is managed as a requirement for the implementation of projects.

2 – Managed Processes are planned and executed in accordance with policy; employ skilled people with adequate resources to produce controlled outputs; involve relevant stakeholders; are monitored and controlled and evaluated for adherence to the defined process. Goal: There is awareness of the importance of managing data as a critical infrastructure asset.

3 – Defined Set of standard processes is employed and consistently followed. Processes to meet specific needs are tailored from the set of standard processes according to the organization’s guidelines. Goal: Data is treated at the organizational level as critical for successful mission performance.

4 – Measured Process metrics have been defined and are used for data management. These include management of variance, prediction, and analysis using statistical and other quantitative techniques. Process performance is managed across the life of the process. Goal: Data is treated as a source of competitive advantage.

5 – Optimized Process performance is optimized through applying Level 4 analysis for target identification of improvement opportunities. Best practices are shared with peers and industry. Goal: Data is critical for survival in a dynamic and competitive market.

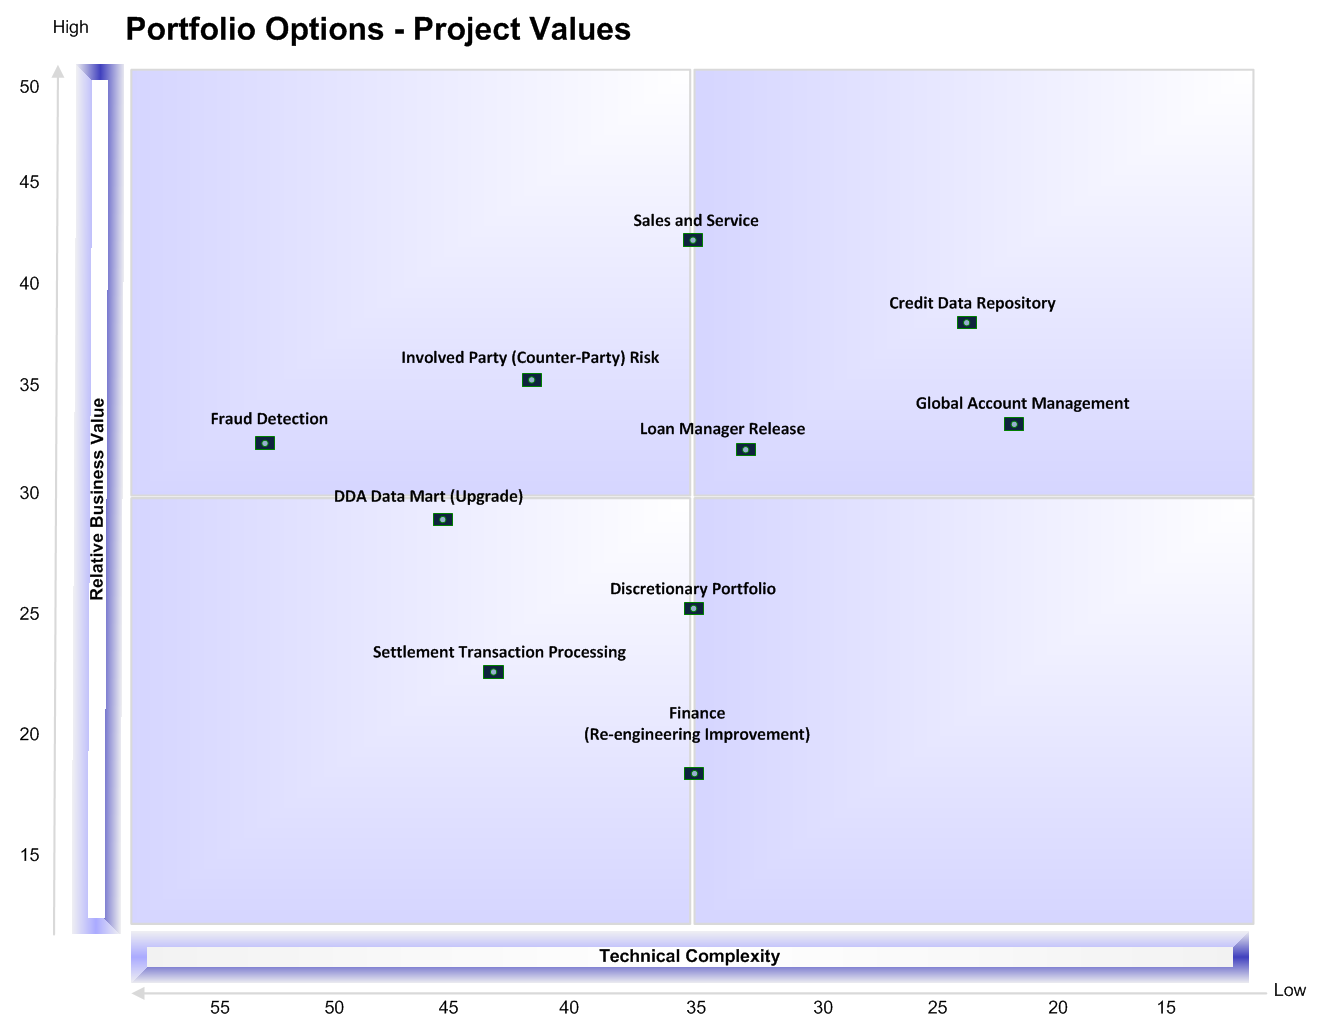
The key here is capturing both current state (what is being performed now) and the desired end state capability using this tool. The difference or delta between the two values now becomes a data set we can use analytic tools to reveal where the greatest challenges are. In this example the clear gaps (represented in orange and red visual cues) show where we should focus our immediate attention and call for further investigation. Yellow shaded topics are less urgent. All green shaded topics don’t need the same rigor when addressing the actions needed in the road map developed in later stages.

DMM_Focus

Specific Subject Area – Master Data Management Assessment
In this example we can extend and focus on Master Data Management using the same principles and structure of CMMI Institute’s Capability Maturity Model Integration (CMMI), adding proven practice in the Master Data Management domain. Note the framework and topic structure is far more focused to match the MDM model framework. And the library of survey questions used here (225 questions) are far more detailed and now very much focused on Master Data Management.

MDM_Topics

Using the same scoring engine we have captured both current state (what is being performed now) and the desired end state capability using this tool. The difference or delta between the two values now becomes a data set we can use analytic tools to reveal where the greatest challenges are. The clear gaps (represented in orange and red visual cues) pop off the page when the size and relative distance from desired or needed and current practice is measured. Now there is a good idea of what needs to be addressed in the road map developed in later stages.

MDM_Focus

This is a quick way to summarize our findings and give valuable clues and direction for further investigation. We can then focus on specific problem areas using detailed schedules based on the field work to date. Based on the gaps uncovered at the higher level summary (Current vs. Desired End State) further investigation should be performed by a professional with deep subject matter expertise and intimate knowledge of generally accepted proven practice. Using the same data set we can now begin to use an interactive exploration tools to uncover significant patterns and reveal further insight.

MDM_Explore_2


Results
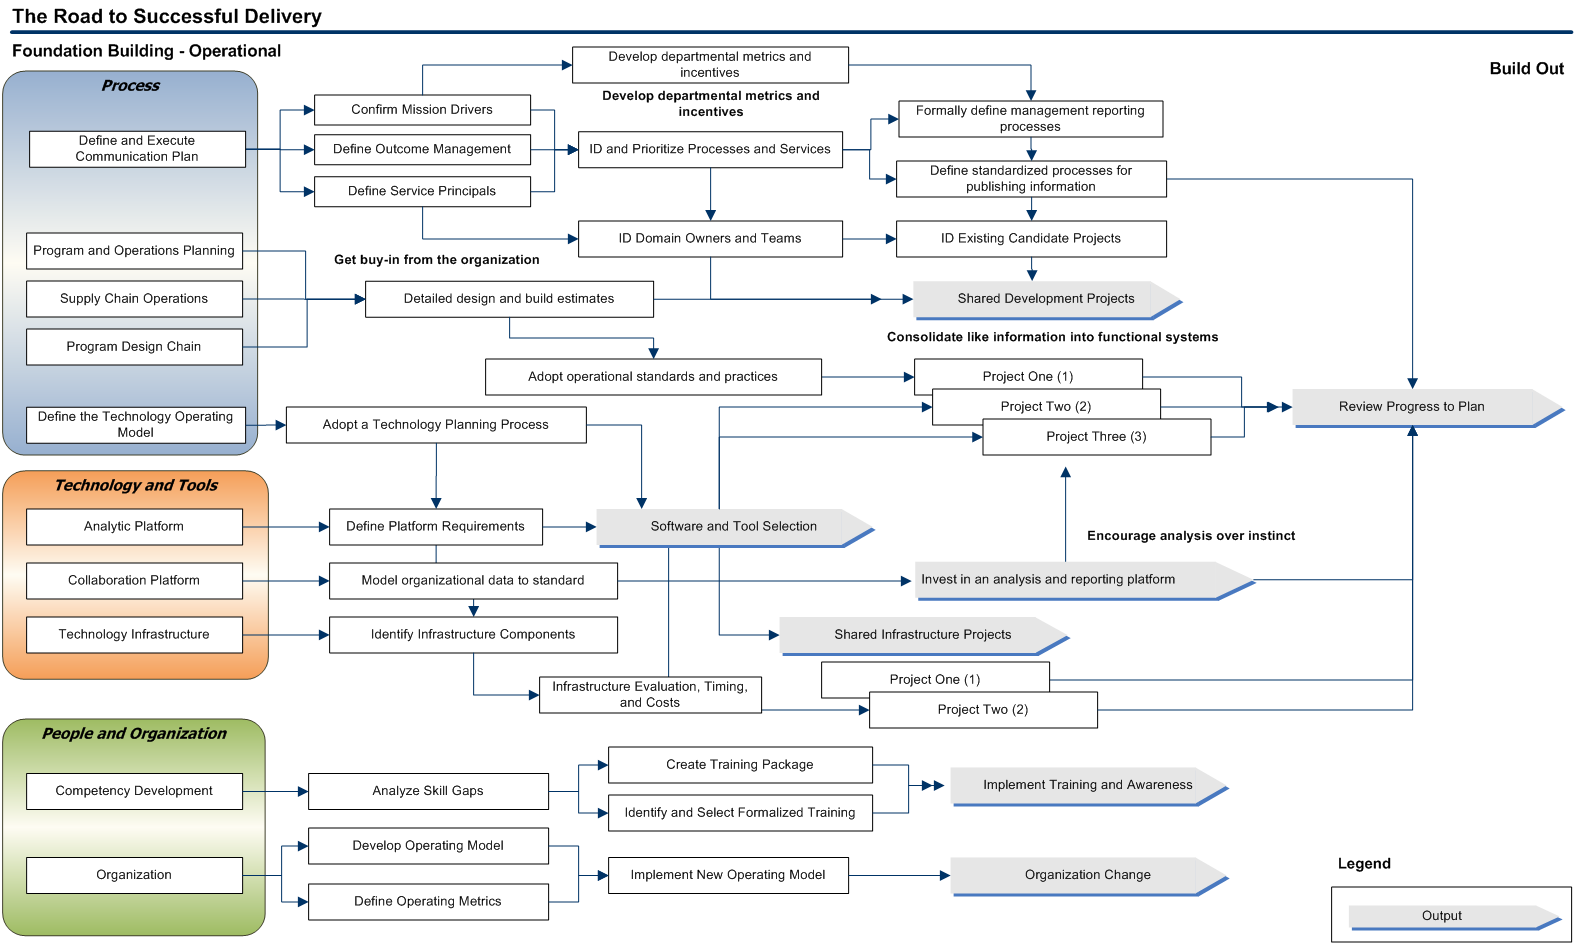
I hope this has helped readers who have asked about how to develop and use gap analysis tools to find quickly what significant delta items (the difference between current and desired states) demand further attention. I think you can see this is valuable way to quickly gather, compile field work, and capture a fairly comprehensive view of the gaps uncovered between the current and desired end state of the subject in question. This method and set of tools can be used in a variety of management challenges across the business both big and small. Armed with this information we can now go ahead to step four (4) and begin to prioritize the findings from the Gap Analysis exercise into a series of gap closure strategies.

This is an invaluable way to assemble and discover the best sequence of actions (recognizing predecessor – successor relationships) as we move to developing the road map. This difference (delta) between these two (current and desired end state) is the basis for our road map. I hope this has answered many of the questions about step three (3) Conduct a Gap Analysis exercise. This is not the only way to do this, but has become the most consistent and repeatable methods I’m aware of to perform a gap analysis quickly in my practice.


If you enjoyed this post, please share with anyone who may help from reading it. And don’t forget to click the follow button to be sure you don’t miss future posts. Planning on compiling all the materials and tools used in this series in one place, still unsure of what form and content would be the best for your professional use.Please take a few minutes and let me know what form and format you would find most valuable.

Suggested content for premium subscribers:

  • Topic Area Models (for use with Mind Jet – see https://www.mindjet.com/ for more)
  • Master Data Management Gap Analysis Assessment
  • Data Maturity Management Capability Assessment
  • Analytic Practice Gap Analysis Assessment
  • Big Data Analytic Gap Analysis Assessment
  • Program Gap Analysis Assessment
  • Program Readiness Assessment
  • Project Gap Analysis Assessment
  • Enterprise Analytic Mind Map
  • Reference Library with Supporting Documents

How to build a Roadmap – Publish

TheRoadAhead_ChildThis post represents the last of the Road Map series I have shared with over 60,000 readers since introduced in March of 2011 at this humble little site alone.  I never would have thought this subject would have attracted so much interest and helped so many over the last three years. Quite frankly I’m astonished at the interest and of course grateful to all the kind words and thoughts so many have shared with me.

The original intent was to share a time tested method to develop, refine, and deliver a professional roadmap producing consistent and repeatable results.  This is should be true no matter how deep or how wide or narrow the scope and subject area we are working with. I think I have succeeded in describing the overall patterns employed.  The only regret I have is not having enough time and patience with the constraints of this media to dive deeper into some of the more complex and trickier aspects of the delivery techniques. I remain pleased with the results given the little time I have had to share with all of you. And sincerely hope that what has worked for me with great success over the years may help you make your next roadmap better.

This method works well across most transformation programs. As I noted earlier most will struggle to find this in textbooks, class rooms, or in your local book store (I have looked, maybe not hard enough). This method I is based loosely on the SEI-CM IDEAL model used to guide development of long-range integrated planning for managing software process improvement programs. Although the SEI focus is software process improvement the same overall pattern can applied easily to other subject areas like organization dynamics and strategy planning in general.

The Overall Pattern
At the risk of over-simplifying things, recall the overall pattern most roadmaps should follow is illustrated in the following diagram.

RoadMap_Pattern

This may look overwhelming at first but represents a complete and balanced approach to understanding what the implications are for each action undertaken across the enterprise as part of a larger program.  You can argue (and I would agree) that this may not be needed for simple or relatively straightforward projects.  What is more likely in this case is the project or activity we are discussing represents a piece or component part of a much larger initiative and will most certainly not need  its’ own roadmap at all. This post is focused on the bigger picture of a collection of projects and activities gathered together to organize and guide multiple efforts in a clear directed manner.

Earlier posts in this series (How to Build a Roadmap) summarized the specific steps required to develop a well thought out road map. The method identified specific actions using an overall pattern all roadmaps should follow. The following steps (and related links to other posts) are required to complete this work:

  1. Develop a clear and unambiguous understanding of the current state
  2. Define the desired end state
  3. Conduct a Gap Analysis exercise
  4. Prioritize the findings from the Gap Analysis exercise into a series of gap closure strategies
  5. Discover the optimum sequence of actions (recognizing predecessor – successor relationships)
  6. Develop and Publish the Road Map

This post wraps up all the hard work to date and assembles the road map to begin sharing the results with stakeholders.  Assuming all the prior work is completed, we are now ready to develop and publish the road map. How this is communicated is critical now. We have the facts, we have the path outlined, and we have a defensible position to share with our peers. We have the details readily available to support our position. Now the really difficult exercise rears its ugly head. Somehow, we need to distill and simply our message to what I call the “Duckies and Goats” view of the world. In other words we need to distill all of this work into a simplified yet compelling vision of how we transform an organization, or enabling technology to accomplish what is needed. Do not underestimate the difficulty in this task. After all the hard work put into an exercise like this, the last thing we need to do is to confuse our stakeholders with mind-numbing detail. Yes, we need this for ourselves to exhaust any possibility we have missed something to ensure we haven’t overlooked the obvious because sometimes “when something is obvious, it may be obviously wrong”.  So what I recommend is a graphical one or two page view of the overall program where each project is linked to successive layers of detail. Each of these successive layers of detail can also be decomposed further if needed to the detailed planning products and supporting schedules. For an example of this see the accompanying diagram which illustrates the concept..

RoadMapExplodedDevelop the Road Map
Armed with the DELTA (current vs. desired end state), the prioritization effort (what should be done), and the optimum sequence (in what order) we can begin to assemble a sensible, defensible road map describing what should be done in what order.  Most of the hard work has already been completed so we should be only be concerned at this point with the careful presentation of the results in a way our stakeholders will quickly grasp and understand.

Begin by organizing the high-level tasks and what needs to be accomplished using a relative time scale usually more fine grained for the first set of tasks typically grouped into quarters.  Recall each set of recommended initiatives or projects has already been prioritized and sequenced (each of the recommended actions recognize predecessor – successor relationships for example).  If this gets too out-of-hand use a simple indexing scheme to order the program using groupings of dimension, priority, sequence, and date related values with your favorite tool of choice.  Microsoft Excel pivot tables work just fine for this, and will help organize this work quickly.  I use the MindJet MindManager product to organize the results into maps I can prune and graft at will.  Using this tool has some real advantages we can use later when we are ready to publish the results and create our detailed program plans.

Each project (task(s)) should be is defined by its goals, milestone deliveries, dependencies, and expected duration across relevant dimensions. For example, the dimensions you group by can include People and Organization, Processes, Technology and Tools, and External Dependencies.  The following illustrates a high-level view of an example Master Data Management roadmap organized across a multiple year planning horizon.

PIM_Hub_01I think it is a good idea to assemble the larger picture first and then focus on the near term work proposed in the road map.  For example, taking the first quarter view of what needs to be accomplished from the executive summary above we can see the first calendar quarter (in this case Q4 2009) of the road map is dedicated to completing the business case, aligning the global strategy, preparing the technical infrastructure for a MDM Product project, and gaining a better understanding of product attribution.  The following illustrates the tasks exploded in the summary to the near term map of what is needed in Q4 2009 (the first quarter of this program).

PIM_Hub_02

Publish the Road Map
At this stage everything we need is ready for publication, review by the stakeholders, and the inevitable refinements to the plan. I mentioned earlier using MindJet MindManager tool to organize the program initiatives into maps.  This tool really comes in handy now to accelerate some key deliverables. Especially useful is the ability to link working papers, schedules, documentation, and any URL hyperlinks needed to support the road map elements. Many still prefer traditional documents (which we can produce with this tool easily) but the real power is quickly assembling the work into a web site that is context aware and a quite powerful way to drill from high level concepts to as much supporting detail as needed.  This can easily accessible without the need for source tools (this is a zero footprint solution) by any stakeholder with a browser. The supporting documentation and URL content can be revised and updated easily without breaking the presentation surface when revisions or refinements are made to the original plan.  I also use the same tool and content to generate skeleton program project plans for us with MS Project. The plans generated can be further refined and used to organize the detailed planning products when ready. Your Program Management Office (PMO) will love you for this.

Think you would agree this is an extremely powerful way to organize and maintain a significant amount of related program content to meet the needs of a wide variety of stakeholders.   An example of a Road Map web site is illustrated in the snapshot below (note, the client name has been blocked to protect their privacy).

SiteImage_02

Results
So, we have assembled the roadmap using a basic pattern used across any discipline (business or technology) to ensure an effective planning effort. This work is not an exercise to be taken lightly. We are after all discussing some real world impacts to come up with a set of actionable steps to take along the way that just make sense. Communicating the findings clearly through the road map meets the intent of the program management team and will be used in a variety of different ways.  For example beyond the obvious management uses consider the following ways this product will be used.

First, the road map it is a vehicle for communicating the program’s overall intent to interested stakeholders at each stage of its planned execution.

  • For downstream designers and implementers, the map provides overall policy and design guidance. The map can be used to establish inviolable constraints (plus exploitable freedoms) on downstream development activities to promote flexibility and innovation if needed.
  • For project managers, the road map serves as the basis for a work, product, and organization breakdown structures, planning, allocation of project resources, and tracking of progress by the various teams.
  • For technical managers, the road map provides the basis for forming development teams corresponding to the work streams identified.
  • For designers of other systems with which this program must interoperate, the map defines the set of operations provided, required, and the protocols that allows the interoperation to take place at the right time.
  • For resource managers, testers and integrators, the road map dictates the correct black-box behavior of the pieces that must fit together.

Secondly, the road map can be used as a basis for performing up-front analysis to validate (or uncover deficiencies in) in design decisions and refining or altering those decisions where necessary.

  • For the architect and requirements engineers who represent the customer(s), the road map is a framework where architecture as a forum can be used for negotiating and making trade-offs among competing requirements.
  • For the architect and component designers, the road map can be a vehicle for arbitrating resource contention and establishing performance and other kinds of run-time resource consumption budgets.
  • For those wanting to develop using vendor-provided products from the commercial marketplace, the road map establishes the possibilities for commercial off-the-shelf (COTS) component integration by setting system and component boundaries.
  • For performance engineers, the map can provide the formal model guidance that drives analytical tools such as rate schedulers, simulations, and simulation generators to meet expected demands at the right time.
  • For development product line managers, the map can help determine whether a potential new member of a product family is in or out of scope, and if out, by how much.

Thirdly, the road map is the first artifact used to achieve program and systems understanding.

  • For technical mangers, the map becomes a basis for conformance checking, for assurance that implementations have in fact been faithful to the program and architectural prescriptions.
  • For maintainers, the map becomes a starting point for maintenance activities, revealing the relative date and areas when a prospective change is planned to take place.
  • For new project members, the map is should be the first artifact for becoming familiar with a program and system’s design intent.

This post wraps up all the hard work to date and assembles the road map to begin sharing with stakeholders impacted by the program as planned.  The original intent was to share a time tested method to develop, refine, and deliver a professional roadmap producing consistent and repeatable results.  I want to thank all of you embarking down this adventure with me over the last couple years. My sincere hope is that what has worked for me time after time may work just as well for you.

How to build a Roadmap – Sequence

An earlier post (How to Build a Roadmap)  in this series summarized the specific steps required to develop a well thought out road map. This roadmap identified specific actions using an overall pattern ALL roadmaps should follow. The steps required to complete this work:

  1. Develop a clear and unambiguous understanding of the current state
  2. Define the desired end state
  3. Conduct a Gap Analysis exercise
  4. Prioritize the findings from the Gap Analysis exercise into a series of gap closure strategies
  5. Discover the optimum sequence of actions (recognizing predecessor – successor relationships)
  6. Develop and Publish the Road Map

This post explores the step where we discover the optimum sequence of actions recognizing predecessor – successor relationships. This is undertaken now that we have the initiatives and the prioritization is done. What things do we have to get accomplished first, before others? Do any dependencies we have identified need to be satisfied before moving forward? What about the capacity for the organization to absorb change? Not to be overlooked, this is where a clear understanding of the organizational dynamics is critical (see step number 1, we need to truly understand where we are). FuturesWheelThe goal is to collect and group the set of activities (projects) into a cohesive view of the work ordered in a typical leaf, branch, and trunk pattern so we can begin to assemble the road map with a good understanding what needs to be accomplished in what order.

Finding or discovering the optimal sequence of projects within the larger program demands you be able to think across multiple dimensions recognizing where there may be second and third order consequences for every action undertaken (see the Future Wheel method for more on this). More of craft than a science the heuristic methods I use refer to experience-based techniques for problem solving, learning, and discovery. This means that the solution is not guaranteed to be optimal. In our case, where an exhaustive search is impractical, I think using heuristic methods to speed up the process of finding a satisfactory solution include using rules of thumb, educated assumptions, intuitive judgment, some stereotyping, and lot of common sense. In our case optimization means finding the “best available” WBS_Diagramordered set of actions subject to the set of priorities and constraints already agreed upon.  The goal is to order each finding from the Gap Analysis in a way that no one project within the program is undertaken without the pre-requisite capability in place. Some of you will see the tree diagram image is a Work Breakdown Structure.  And you are right. This is after all our goal and represents the end-game objective. The sequencing is used and re-purposed directly into a set of detailed planning products organized to guide the effort.

What to think about
Developing a balanced well-crafted road-map is based on the “best available” ordered set of actions subject to the set of priorities (and constraints) already agreed upon.  When you think about this across multiple dimensions it does get a little overwhelming so I think the best thing to do is break the larger components into something we can attack in pieces and merge together later. After this set of tasks is accomplished we should always validate and verify or assumptions and assertions made to ensure we have not overlooked a key dependency.

Technology layer overviewI’m not going to focus on the relatively straight forward task in the technology (infrastructure) domains many of us are familiar with. Following a simple meta-model like this one from the Essential Architecture project (simplified here to illustrate the key concepts) means we can grasp quickly the true impact of an adoption of a new capability would have, and what is needed to realize this in the environment as planned. Where I will focus is on the less obvious. This is the  relationships across the other three domains (Business, Information, and Applications) which will be dependent on this enabling infrastructure.  And no less important is the supporting organization ability to continue to deliver this capability when the “consultants” and vendors are long gone.

So if you look at the simple road map fragment illustrated below note the technology focus. Notice also what is missing or not fully developed. Although we have a bubble labeled “Build Organizational Capability” it is not specific and detailed enough to understand how important this weakness is to overcoming an improved product because of the technology focus.RoadMap_Example_01Understanding of this one domain (technology) becomes a little trickier when take into account and couple something like an Enterprise Business Motivation Model for example . Now we can extend our simple sequence optimization with a very thoughtful understanding of all four architecture domains to truly understand what the organization is capable of supporting. So I’m going to reach into organizational dynamics now assuming all of us have a very good understanding as architects of what needs to be considered in the information, application, and supporting technology domains.

Organization Maturity Models
Before diving into the sequence optimization we should step back and review some of our earlier work. As part of understanding current and desired end states we developed a pretty acute awareness of the organization profile or collection of characteristics to describe ourselves. There are many maturity models available (CMMI, Information Management Maturity Model at Mike 2.0, and the NAS CIO EA Maturity Model) that all share the same concepts usually expressed in five or six levels or profiles ranging from initiating (sometimes referred to as chaos) to optimized. Why is this important? Each of these profiles includes any number of attributes or values that can be quantified to gain a deeper understanding of capability. This where the heuristic of common sense and intuitive judgment is needed and overlooked only at the risk of failure.  For example, how many of us have been engaged in a SOA based adoption only to discover the technology is readily achievable but the organization’s ability to support widespread adoption to realize the value is not manageable or produces unintended consequences.  Why does this happen so often? One of the key pieces of insight I can share with you is there seems to be a widespread assumption you can jump or hurdle one maturity profile to another by ensuring all prerequisite needs are adopted and in use.  Here is a real world case to illustrate this thought.

SOA_Architecture_Capability

Note there were thirteen key attributes evaluated as part of the global SOA adoption for this organization. What is so striking about this profile (this is not my subjective evaluation, this is based on the client’s data) is the relative maturity of Portfolio Management and integration mechanisms and the low maturity found in some core competencies related to architecture in general.  Core competency in architecture is key building block to adopting SOA on the size and scale as planned.   The real message here is this organization (at least in the primary architecture function) is still a Profile 1 or Initiating. Any attempt to jump to a Defined or even Managed profile cannot happen until ALL key characteristics are addressed and improved together.  The needle only moves when the pre-requisites are met. Sounds simple enough, can’t count how often something this fundamental is overlooked or ignored.

Organization Profile
This is a little more sophisticated in its approach and complexity. In this case we are going to use a maturity model that attempts to clarify and uncover some of the organizational dynamics referred to earlier in our Gap Analysis. This model is based on the classic triangle with profiles ranging from Operational to Innovating (with a stop at Optimizing along the way).  Each profile has some distinct characteristics or markers we should have recognized when base lining the Current State (if you used the Galbraith Star Model to collect you findings, its results can always be folded or grouped into this model as well).  Within each of the profiles there a couple of dimensions that represent the key instrumentation to measure the characteristics and attributes of the organization’s operating model. This is useful to measure as the organization evolves from one Profile to another and begins to leverage the benefits of each improvement in reach and capability.

Profile Triangle

We use this to guide us to select the proper sequence. The dimensions used within each of the six profiles in this model include:

Infrastructure (Technology)
The computing platforms, software, networking tools, and technologies (naming services for example) used to create, manage, store, distribute and apply information.  This is the Technology architecture domain I referred to earlier.

Processes
Policies, best practices, standards and governance that define: how information is generated, validated and used.  How information is tied to performance metrics and reward systems.  How the company supports its commitment to strategic use of information.

Human capital
The information skills of individuals within the organization and the quantifiable aspects of their: 

    • capability, 
    • recruitment, 
    • training, 
    • assessment and 
    • alignment with enterprise goals.

Culture
Organizational and human influences on information flow — the moral, social and behavioral norms of corporate culture (as shown in the attitudes, beliefs and priorities of its members), as related to the use and value of information as a long-term strategic corporate asset.

What this reveals about our sequencing is vital to understanding key predecessor – successor relationships. For example, a Profile 1 (Initiating) organizations are usually successful due to visionary leaders, ambitious mavericks and plain good old-fashioned luck. Common characteristics include: 

  • Individual leaders or mavericks with authority over information usage 
  • Information infrastructure (technology and governance processes) that is nonexistent, limited, highly variable or subjective 
  • Individual methods of finding and analyzing information 
  • Individual results adopted as “corporate truth” without the necessary validation

Significant markers you can look for are usually found in the natural self-interests of individuals or “information mavericks” who will often leverage information to their own personal benefit. Individuals flourish at the expense of the organization. The silo orientation tends to reward individual or product-level success even as it cannibalizes other products or undermines enterprise profitability. Because success in this environment depends on individual heroics, there is little capability for repeating successful processes unless the key individuals remain the same. This dynamic never scales and in the worst cases the organization is impaired every time one of “these key employees” leaves taking their expertise with them.

By contrast a Profile 3 (Integrated) organization has acknowledged the strategic and competitive value of information. This organization has defined an information management culture (framework) to satisfy business objectives. Initiatives have been undertaken enhance the organization’s ability to create value for customers rather than catering to individuals, departments, and business units. Architecture integrates data from every corner of the enterprise — from operational/transactional systems, multiple databases in different formats and from multiple channels. The key is the ability to have multiple applications share common “metadata” — the information about how data is derived and managed. The result is a collaborative domain that links previously isolated specialists in statistics, finance, marketing and logistics and gives the whole community access to company-standard analytic routines, cleansed data and appropriate presentation interfaces. Common characteristics include:

  • Cross-enterprise information. 
  • Decisions made in the context of enterprise goals. 
  • Enterprise information-governance process. 
  • Enterprise data frameworks. 
  • Information-management concepts applied and accepted. 
  • Institutional awareness of data quality.

So how well do think adopting an enterprise analytic environment is going to work in a Profile I (Initiating) organization?  Do you think we have a higher probability of success if we know the organization is closer to a Profile III (Integrated) or higher?

I thought so.

In this case, the sequencing should reflect a focus on actions that will move and evolve the organization from a 1 (Initiating) to a 2 (Consolidated), eventually arriving at a 3 (Integrated) profile or higher.

Understanding the key characteristics and distinct markers found in the organization you are planning for at this stage will be a key success factor. We want to craft a thoughtful sequence of actions to address organization and process related gaps in a way to that is meaningful.  Remember has much as we wish, any attempt to jump to a higher profile cannot happen until ALL key characteristics are addressed and improved together.  So if we are embarking on a truly valuable program remember this fundamental.  In almost every roadmap I have reviewed or evaluated by others not very many of them seek to understand this critical perspective. Not really sure why this is the case since an essential element of success to any initiative is ensuring specific actionable activities and management initiatives include:

  • Building organizational capability, 
  • Driving organizational commitment, and 
  • The program will not exceed the organization’s capability to deliver.

Results
Now that we have gathered all the prioritized actions, profiled the organization’s ability to deliver, and have the right enabling technology decisions in the right order it’s time to group and arrange the findings. While the details should remain in your working papers there are a variety presentation approaches you can take here. I prefer to group the results into easy to understand categories and then present the high level projects together to the team as a whole.  In this example (simplified and edited for confidentiality) I have gathered the findings into two visual diagrams illustrating the move from a Profile 1 (Operational) labeled Foundation Building, to a Profile II (Consolidated) labeled Build Out.  I have also grouped the major dimensions (Infrastructure, Processes, Human Capital and Culture) into three categories labeled Process and Technology, and combined Human Capital and Culture into Organization to keep things simple.

First the Profile I diagram is illustrated below. Note we are “foundation building” or identifying the optimal sequence to build essential capability first.

Profile 1 Roadmap

The move to a Profile II (Consolidated) is illustrated below. In this stage we are now leveraging the foundation building from earlier actions to begin to leverage what is important and take advantage of the capability to be realized.

Profile 2 Roadmap

Note at this time there is no times scale used; only a relative size denoting an early estimate of the level of effort from the Gap Analysis findings.  There is however a clear representation of the order of what actions should be taken in what order.  With this information we are now ready to move to the next step to develop and publish the completed Road Map.

How to build a Roadmap – Prioritize (Part II)

An earlier post in this series (How to Build a Roadmap)  summarized the specific steps required to develop a well thought out road map. This roadmap identified specific actions using an overall pattern ALL roadmaps should follow. The steps required to complete this work:

  1. Develop a clear and unambiguous understanding of the current state
  2. Define the desired end state
  3. Conduct a Gap Analysis exercise
  4. Prioritize the findings from the Gap Analysis exercise into a series of gap closure strategies
  5. Discover the optimum sequence of actions (recognizing predecessor – successor relationships)
  6. Develop and Publish the Road Map

Rearranging-Your-PrioritiesThis post will continue with the prioritization steps we started with in How to build a Roadmap – Prioritize (Part I). The activity will use the results from steps 1 – 3 to prioritize the actions we have identified to close the gap or difference (delta) from where we are to what we aspire to become.   In short, we want to IDENTIFY what is feasible and what has the highest business value balancing business need with the capability to execute.

Prioritize Gap Analysis Findings
After the gaps analysis is completed further investigation should be performed by a professional with subject matter expertise and knowledge of generally accepted best practices.  It is best to use prepared schedules in the early field work (if possible) to begin gathering and compiling the facts needed during the interview processes to mitigate “churn” and unnecessary rework. This schedule will be populated with our findings, suggested initiatives or projects, expected deliverables, level of effort, and a preliminary priority ranking of the gap identified.  At this point we have a “to-do” list of actionable activities or projects we can draft the working papers with for the prioritization review process using a variety of tools and techniques.

todolistThe prioritization review is an absolutely essential step prior to defining the proposed program plans in the road map. Scheduled review sessions with key management, line managers, and other subject matter experts (SME) serves to focus all the major activities for which the function or subject area is responsible.  We are asking this group of stakeholders to verify and confirm the business goals and objectives as value criteria and to score the relative importance of each gap identified.  The following section describes the available techniques but is by no means an exhaustive survey of what is available.

Prioritization Methods
There are a number of approaches to prioritization that are useful. There are also some special cases where you’ll need other tools if you’re going to be truly effective.  Many of these techniques are often used together to understand the subtle aspects and nuances of organizational dynamics. The tools and methods include:

Paired Comparison Analysis
Paired Comparison Analysis (sometimes referred to as Pairwise Comparison) is most useful when the decision criteria are vague, subjective or inconsistent (like we find most of the time). This is not a precision exercise. The analysis is useful for weighing up the relative importance of different options. It’s particularly helpful where:

  • priorities aren’t clear,
  • the options are completely different,
  • evaluation criteria are subjective, or they’re competing in importance.

Apples_OrangesWe prioritize options by comparing each item on a list with all other items on the list individually. By deciding in each case which of the two is most important, we can consolidate results to get a prioritized list. This can be especially challenging when the choices are quite different from one another, decision criteria are subjective, or there is no objective data to use. This makes it easy to choose the most important problem to solve, or to pick the solution that will be most effective. It also helps set priorities where there are conflicting demands or resource constraints that need to be considered.

Grid Analysis
Grid Analysis helps prioritize a list of tasks where you need to take many different factors into consideration. Grid Analysis is the simplest form of Multiple Criteria Decision Analysis (MCDA), also known as Multiple Criteria Decision Aid or Multiple Criteria Decision Management (MCDM). Sophisticated MCDA can involve highly complex modeling of different potential scenarios, using advanced mathematics. Grid Analysis is particularly powerful where you have a number of good alternatives to choose from, and many different factors to take into account. This is a good technique to use in almost any important decision where there isn’t a clear and obvious preferred option. Grid Analysis works by listing options as rows on a table, and the factors you need consider as columns. Conversely you can populate the rows with business drivers and the rows with technical factors. The intent is to score each factor combination, weight this score by the relative importance of the factor, and add these scores up to give an overall score for each option.

Action Priority Matrix
Closely related to Grid analysis is the Action Priority matrix. This quick and simple diagramming technique plots the value of the candidate tasks against the level of effort or technical feasibility to deliver. By doing this we can quickly spot the “quick wins” giving you the greatest rewards in the shortest possible time, and avoid the “hard rocks” which soak up time for little eventual reward. This is an ingenious approach for making highly efficient prioritization decisions.

I illustrated this approach in detail in the first part of this step in How to build a Roadmap – Prioritize (Part I). This earlier post described how we take relatively “subjective” set of inputs and prepare a simple quadrant graph where technical feasibility and business value represent the X and Y axis respectively. This quantifies the relative priority of each candidate set of processes impacted subjected to technical feasibility constraints.  The result is an easy to see visual representation of what is important (relative business value) and technically feasible. In short the method (as summarized here) has helped us prioritize where to focus our efforts and aligned business need with the technical capability to deliver.

Urgent/Important Matrix
Similar to the Action Priority Matrix this technique considers whether candidate tasks or projects are urgent or ImportantUrgentimportant. Sometimes, seemingly urgent gaps really aren’t that important. The Urgent/Important Matrix helps by using the gap analysis task list and quickly identifying the activities we should focus on. By prioritizing using the Matrix, we can deal with truly urgent issues while working towards important goals.  The distinction is subtle but important. Urgent activities are often the ones we concentrate on; they demand attention because the consequences of not dealing with them are immediate.  “What is important is seldom urgent and what is urgent is seldom important,” sums up the concept of the matrix perfectly. This so-called “Eisenhower Principle” is said to be how Eisenhower organized his tasks. As a result, the matrix is sometimes called the Eisenhower Matrix..

Somewhat related to this technique is the MoSCoW method.  This is named because the acronym is related to grouping the alternative actions into four discrete types.

  • M – MUST: Describes an action (or requirement) that must be satisfied in the final solution for the solution to be considered a success. In other words not a high, non-negotiable priority.
  • S – SHOULD: Represents a high-priority item that should be included in the solution if it is possible. This is often a critical action (requirement) but one which can be satisfied in other ways if necessary.
  • C – COULD: Describes an action (requirement) which is considered desirable but not necessary. This will be included if time, dependencies, and resources permit.
  • W – WOULD: Represents a requirement that stakeholders have agreed will not be implemented in a given release, but may be considered for the future (sometimes the word “Won’t” is substituted for “Would” to give a clearer understanding of this choice). This is usually associated with low priority actions.

The o’s in MoSCoW are added simply to make the word pronounceable, and are often left lower case to indicate that they don’t stand for anything. Most often used with time boxing where a deadline is fixed so that the focus can be on the most important actions or requirements. This is often used as a core aspect of rapid application development (RAD) software development processes, such as Dynamic Systems Development Method (DSDM) and agile software development techniques. In this context we are “borrowing” from application development to quickly arrive at a priority scheme or relative measure of how important each proposed action is to the business.

Ansoff Matrix and the Boston Matrices
These give you quick “rules of thumb” for prioritizing opportunities uncovered in the gap analysis. The Ansoff Matrix helps evaluate and prioritize opportunities by risk. The Boston Matrix does a similar job, helping to prioritize opportunities based on the attractiveness of a market and our ability to take advantage of it. There is much more information about the Ansoff Matrix and the Boston Matrix at these links.

Pareto Analysis
Pareto Analysis helps identify the most important of the gap analysis changes identified to make.  It is a simple technique for prioritizing problem-solving work so that the first piece of work proposed resolves the greatest number of gaps or challenges uncovered. The Pareto Principle (known as the “80/20 Rule”) is the idea that 20% of the gap Parettocandidates may generate 80% of results. In other words we are seeking to find the 20% of closure actions that will generate 80% of the results expected that attacking all of the identified work would deliver. While this approach is great for identifying the most important root cause to deal with, it doesn’t take into account the cost of doing so. Where costs are significant, you’ll need to use techniques such as Cost/Benefit Analysis, or use IRR and NPV methods to determine which priority based changes you should move ahead with. To use Pareto Analysis, identify and list the gap candidates and their causes. Score each problem and group them together by their cause. Then add up the score for each group. Finally, work on finding a solution to the cause of the problems in the group with the highest score. Pareto Analysis not only shows you the most important gap to solve, it also gives you a score showing how severe the gap is relative to the others.

Analytic Hierarchy Process (AHP)
The Analytic Hierarchy Process is useful when there are difficult choices to make in a complex, subjective situation with more than a few options.  The method (AHP) is included in most operations research and management science textbooks, and is taught in numerous universities. While the general consensus is that it is both technically valid and practically useful, the method does have its critics. Most of the criticisms involve a phenomenon called rank reversal which is described here.

To address this problem, Thomas Saaty created the Analytic Hierarchy Process (AHP) combining qualitative and quantitative analysis. This technique is useful because it combines two approaches –mathematics, and the subjectivity and of psychology – to evaluate information and make priority decisions that are easy to defend.

AHP_01

Simply put ranking is a relationship between a set of items such that, for any two items, the first is either ‘ranked higher than’, ‘ranked lower than’ or ‘ranked equal to’ the second. In mathematics, this is known as a weak order or total preorder of objects. It is not necessarily a total order of objects because two different objects can have the same ranking. The rankings themselves are totally ordered.  By reducing detailed measures to a sequence of ordinal numbers, rankings make it possible to evaluate complex information according to certain criteria. This is how an Internet search engine may rank the pages it finds according to an estimation of their relevance making it possible for us to quickly select the pages we are most likely interested in.

Results
I think you can see there are a couple of techniques we can use to prioritize the findings from our gap analysis into a coherent, thoughtful set of ordered actions we can take. Armed with this consensus view we can now proceed to step five (5) to assemble and discover the optimum sequence of actions (recognizing predecessor – successor relationships) as we move to developing the road map. Many of the techniques discussed here can (and should be combined) to capture consensus on priority decisions. My professional favorite is the approach found in the Action Priority Matrix due to its structure and group involvement for making highly efficient prioritization decisions. Now that we have the priorities in hand we have the raw materials needed to move forward and produce the road map.

How to build a Roadmap – Prioritize (Part I)

An earlier post (How to Build a Roadmap)  in this series summarized the specific steps required to develop a well thought out road map. This roadmap identified specific actions using an overall pattern ALL roadmaps should follow. The steps required to complete this work:

  1. Develop a clear and unambiguous understanding of the current state
  2. Define the desired end state
  3. Conduct a Gap Analysis exercise
  4. Prioritize the findings from the Gap Analysis exercise into a series of gap closure strategies
  5. Discover the optimum sequence of actions (recognizing predecessor – successor relationships)
  6. Develop and Publish the Road Map

This post will discuss how to use the results from steps 1 – 3 to prioritize the actions we have identified to close theBalance  gap or difference (delta) from where we are to what we aspire to be. This is usually driven in a technology road map by evaluating the relative business value AND the technical complexity, plotting the results in a quadrant graph using an Action Priority Matrix. It is critical here that the stakeholders are engaged in the collection of the data points and they are keenly aware of what they are scoring. What we are doing here is IDENTIFYING what is feasible and what has the highest business value balancing business need with the capability to execute.

We do this because the business will have goals and objectives that may not align with the individuals we collaborated with in our field work. We are making this process visible to all stakeholders to help discover what the tactical interpretation of the gap closure strategy really means. The tactical realization of the strategy (and objectives) is usually delegated (and rightly so) to the front line management. The real challenge is eliciting, compiling, and gaining agreement on what is important and urgent to each of the stakeholders. This is not an easy exercise and demands a true mastery of communication and facilitation skills many are not comfortable with or have exercised on a regular basis.  A clear understanding of the complex interaction of any organization (and their un-intended consequences) is critical to completing this exercise.

Prioritize Gap Analysis Findings

After the gaps analysis is completed further investigation should be performed by a professional with deep subject matter expertise and intimate knowledge of generally accepted best practices.  In fact it is best to use prepared schedules in the early field work (if possible) to begin gathering and compiling the facts needed during the interview processes to mitigate “churn” and unnecessary rework. Using this schedule we will have captured our findings, suggested initiatives or projects, expected deliverables, level of effort, and relative priority of the gap identified.  This level of effort and relative priority from this set of initial facilitated sessions is used to draft overall priorities that would drive planning for the initial and subsequent releases of the improvements as planned.  At this point we have a “to-do” list of actionable activities or projects we can draft the working papers with for the prioritization review process using a variety of tools and techniques.  I think the prioritization review is an absolutely essential step prior to defining the proposed program plans in the road map we are constructing. The review schedules facilitated sessions with key management, line managers, and other subject matter experts (SME) of the functional area in focus to identify the list of business processes representing all the major activities for which the functional area is responsible.  In addition, we are asking this group of stakeholders to verify and confirm the business goals and objectives as value criteria and to score the relative importance of each gap identified.  The following section describes some of the more useful techniques but is by no means an exhaustive survey of what is available.

Prioritization Methods

There are a number of approaches to prioritization that are useful. There are also some special cases where you’ll need other tools if you’re going to be truly effective.  Note, many of these techniques are often used together to understand the subtle aspects and nuances of organization dynamics. The tools and methods include:

I’m going to focus on the Action Priority Matrix method in this post. I will discuss the other methods in a second part to this post in the coming weeks. The Action Priority method is a quick and simple technique used to determine where the value of the candidate projects (tasks) is plotted against the level of effort or technical feasibility to deliver. This provides easy to see visual cues to quickly spot the “quick wins” and the greatest rewards in the shortest possible time. I have focused on this ingenious approach for making highly efficient prioritization decisions because it works well to organize and simplify a lot of multifaceted options in one place.

Action Priority Matrix

The Action Priority matrix is closely related to Grid analysis. This quick and simple diagramming technique plots the value of the candidate tasks against the level of effort or technical feasibility to deliver. By doing this we can quickly spot the “quick wins” giving you the greatest rewards in the shortest possible time, and avoid the “hard rocks” which soak up time for little eventual reward. We begin by asking the stakeholders to verify and confirm the business goals and objectives as value criteria (e.g., increase revenue share, increase brand image, etc.) and to score the relative importance of each gap identified. This is accomplished by multiplying a weight factor (based on a 100 point pool) by a 1 to 5 score (low or nonexistent support to very high support of business value criteria) for each process or gap identified.  This business value score is combined with a technical feasibility score (based on a similar scoring method using criteria such as availability and reliability of source data) to define a data point on a risk matrix.  The completed matrix map helps to clarify priorities where a high degree of feasibility exists in delivering the business need.  The participants will reach consensus upon review of the scoring results and how associated data points align in the matrix.  The goal of this review is to determine the relative importance of each candidate action that will be supported by the initial or subsequent road map decisions.

The following diagram illustrates a simplified summary of what this technique looks like in practice. In this case we have summarized a set of business processes whose relative weight is scored by the business in the top quadrant. The technical team has scored each candidate set of processes in the lower quadrant independent of the business in terms of feasibility (level of effort estimated to complete).

ActionPriority_01

The results of this exercise are now compiled and summarized in the diagram below.

ActionPriority_02

We can now take this relatively “subjective” set of inputs and prepare a simple quadrant graph where technical feasibility and business value represent the X and Y axis respectively. We have in effect quantified the relative priority of each candidate set of processes impacted subjected to technical feasibility constraints and displayed the results in a relatively easy to see visual representation of what is important (relative business value) and technically feasible. In short the method (as summarized here) has helped us prioritize where to focus our efforts and aligned business need with the technical capability to deliver.

Action_Priority_03

Here is another example where technical feasibility and business values are reversed or represented now by the Y and X axis respectively. This illustrates the versatility and flexibility with this method where it is more important to express the relative value of each option explored than worry about the absolute precision of the findings.

Action_Priority_04

Sometimes it is better to use the Nominal Group Technique before reviewing together as a group. This technique is a useful for prioritizing issues and projects within a group, giving everyone fair input into the prioritization process before reviewing the Action Matrix as a group. This is particularly useful where consensus is important and a robust group decision needs to be made. Using this tool, each group participant “nominates” his or her priority issues independently, and then ranks them on a scale, of say 1 to 10. The score for each issue is then added up, with issues then prioritized based on scores. The obvious fairness of this approach makes it particularly useful where prioritization is based on subjective criteria, and where people’s “buy in” to the prioritization decision is needed. This is especially useful because when a group meets the people who shout loudest, or those with higher status in the organization get their ideas heard more than others. So when it comes to gaining consensus on important decisions or priorities, how do you make sure you get true consensus and a fair decision for the group? The benefit of the technique is that the group shares and discusses all issues after independent evaluation, with each group member participating equally in evaluation. The evaluation works with each participant “nominating” his or her priority issues, and then ranking them on a scale of, say, 1 to 10.  Discussing the results together mitigates the noise and distractions of those who do shout the loudest or dominate group dynamics.

Results

I think you can see there are a couple of techniques we can use to prioritize the findings from our gap analysis into a coherent, thoughtful set of ordered actions we can take. Will be discussing other methods and techniques you can use in the coming weeks. Many of the techniques discussed here can (and should be combined) to capture consensus on priority decisions. I focused on this first part on the Action Priority Matrix method due to its structure and group involvement for making highly effective and efficient prioritization decisions.