How to build a Roadmap – Publish

TheRoadAhead_ChildThis post represents the last of the Road Map series I have shared with over 60,000 readers since introduced in March of 2011 at this humble little site alone.  I never would have thought this subject would have attracted so much interest and helped so many over the last three years. Quite frankly I’m astonished at the interest and of course grateful to all the kind words and thoughts so many have shared with me.

The original intent was to share a time tested method to develop, refine, and deliver a professional roadmap producing consistent and repeatable results.  This is should be true no matter how deep or how wide or narrow the scope and subject area we are working with. I think I have succeeded in describing the overall patterns employed.  The only regret I have is not having enough time and patience with the constraints of this media to dive deeper into some of the more complex and trickier aspects of the delivery techniques. I remain pleased with the results given the little time I have had to share with all of you. And sincerely hope that what has worked for me with great success over the years may help you make your next roadmap better.

This method works well across most transformation programs. As I noted earlier most will struggle to find this in textbooks, class rooms, or in your local book store (I have looked, maybe not hard enough). This method I is based loosely on the SEI-CM IDEAL model used to guide development of long-range integrated planning for managing software process improvement programs. Although the SEI focus is software process improvement the same overall pattern can applied easily to other subject areas like organization dynamics and strategy planning in general.

The Overall Pattern
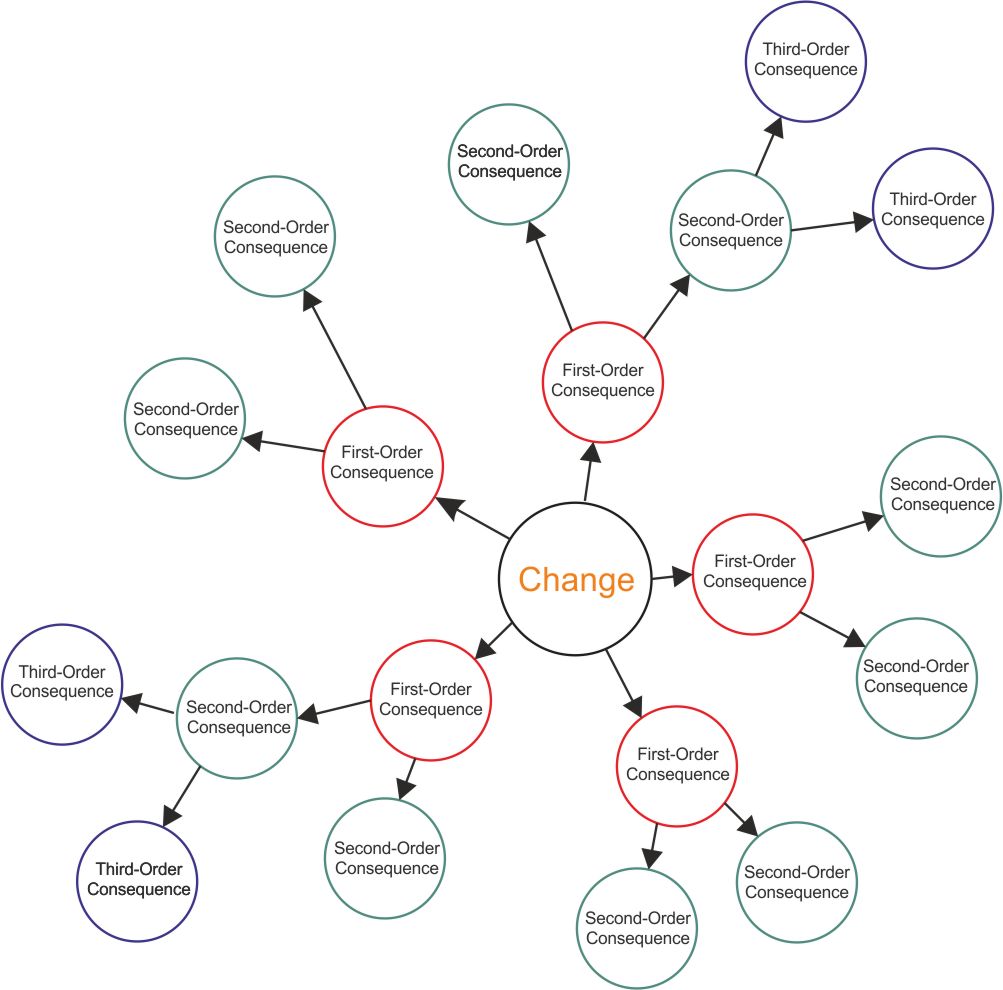
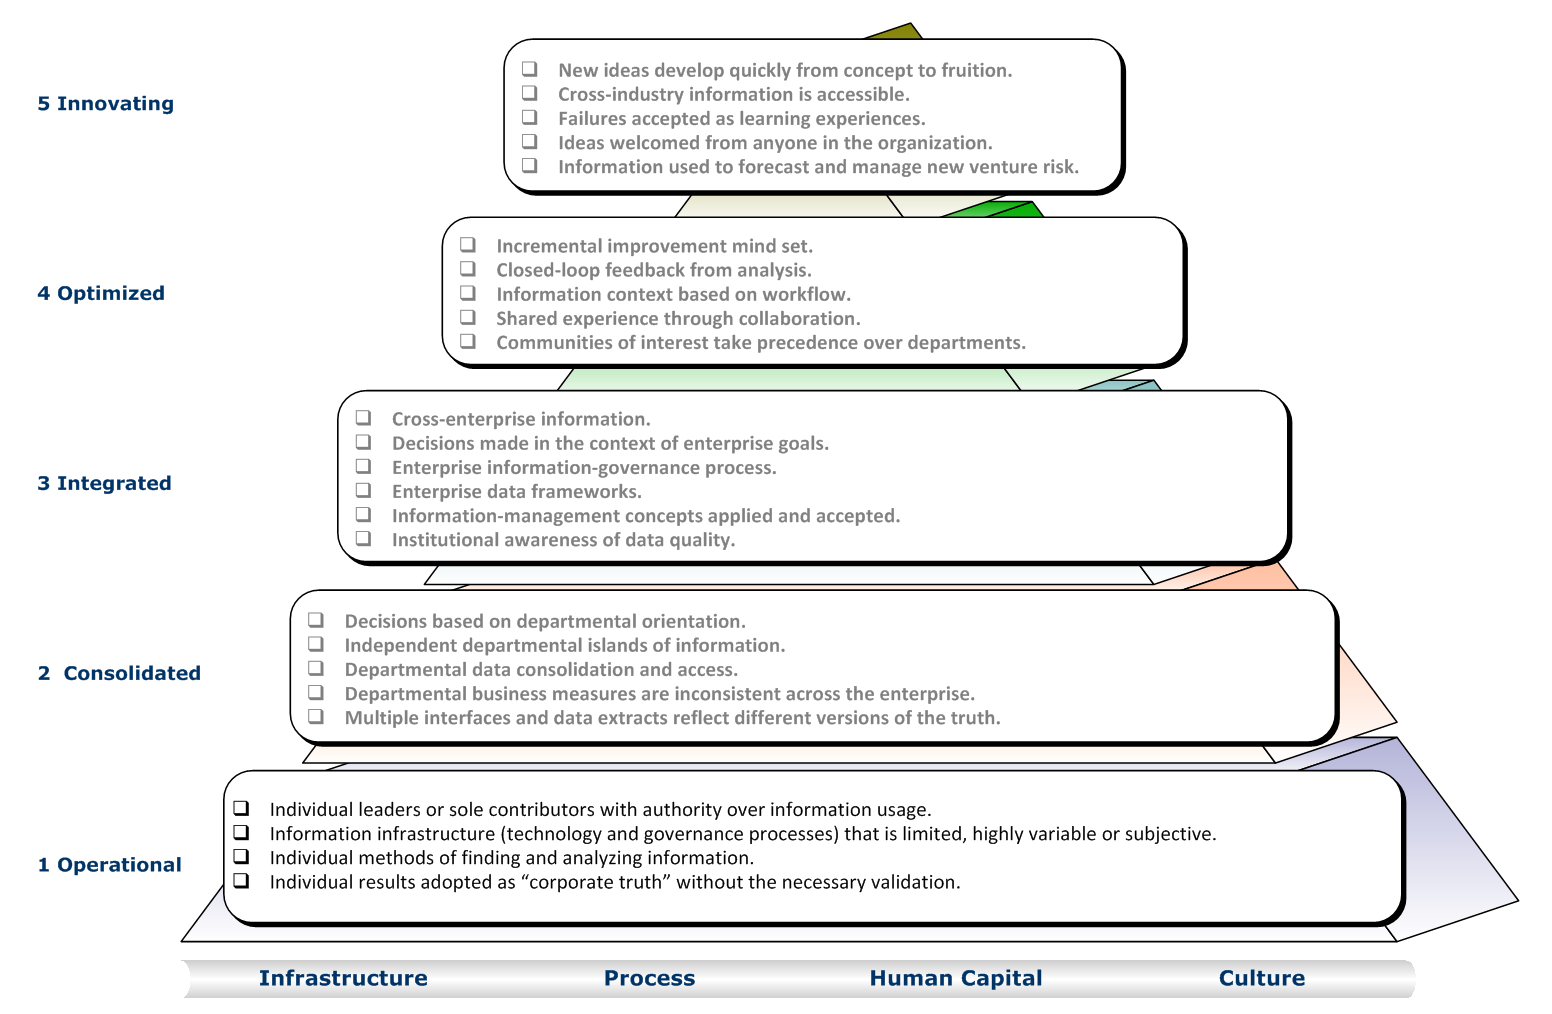
At the risk of over-simplifying things, recall the overall pattern most roadmaps should follow is illustrated in the following diagram.

RoadMap_Pattern

This may look overwhelming at first but represents a complete and balanced approach to understanding what the implications are for each action undertaken across the enterprise as part of a larger program.  You can argue (and I would agree) that this may not be needed for simple or relatively straightforward projects.  What is more likely in this case is the project or activity we are discussing represents a piece or component part of a much larger initiative and will most certainly not need  its’ own roadmap at all. This post is focused on the bigger picture of a collection of projects and activities gathered together to organize and guide multiple efforts in a clear directed manner.

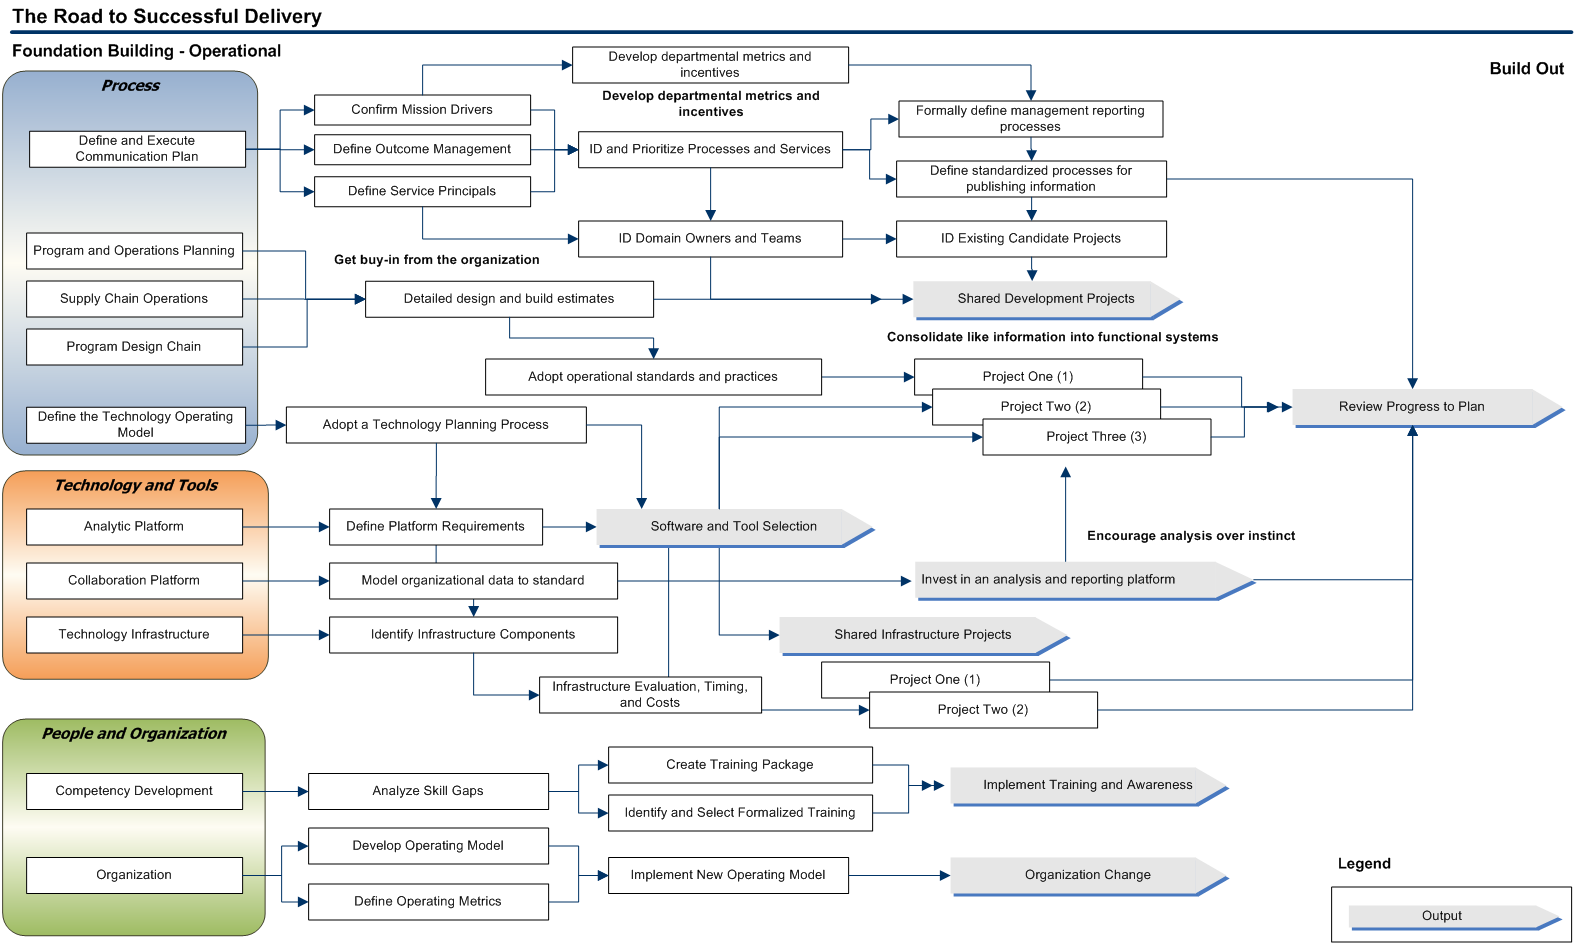
Earlier posts in this series (How to Build a Roadmap) summarized the specific steps required to develop a well thought out road map. The method identified specific actions using an overall pattern all roadmaps should follow. The following steps (and related links to other posts) are required to complete this work:

  1. Develop a clear and unambiguous understanding of the current state
  2. Define the desired end state
  3. Conduct a Gap Analysis exercise
  4. Prioritize the findings from the Gap Analysis exercise into a series of gap closure strategies
  5. Discover the optimum sequence of actions (recognizing predecessor – successor relationships)
  6. Develop and Publish the Road Map

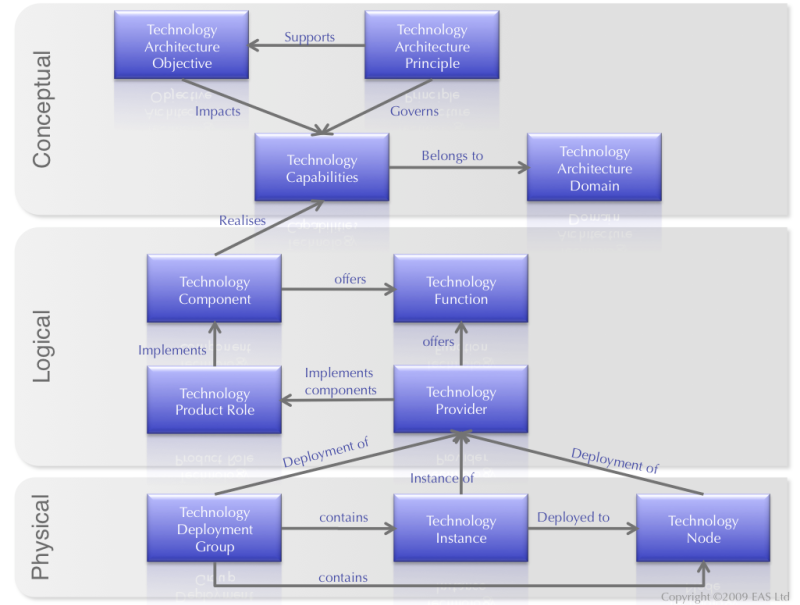
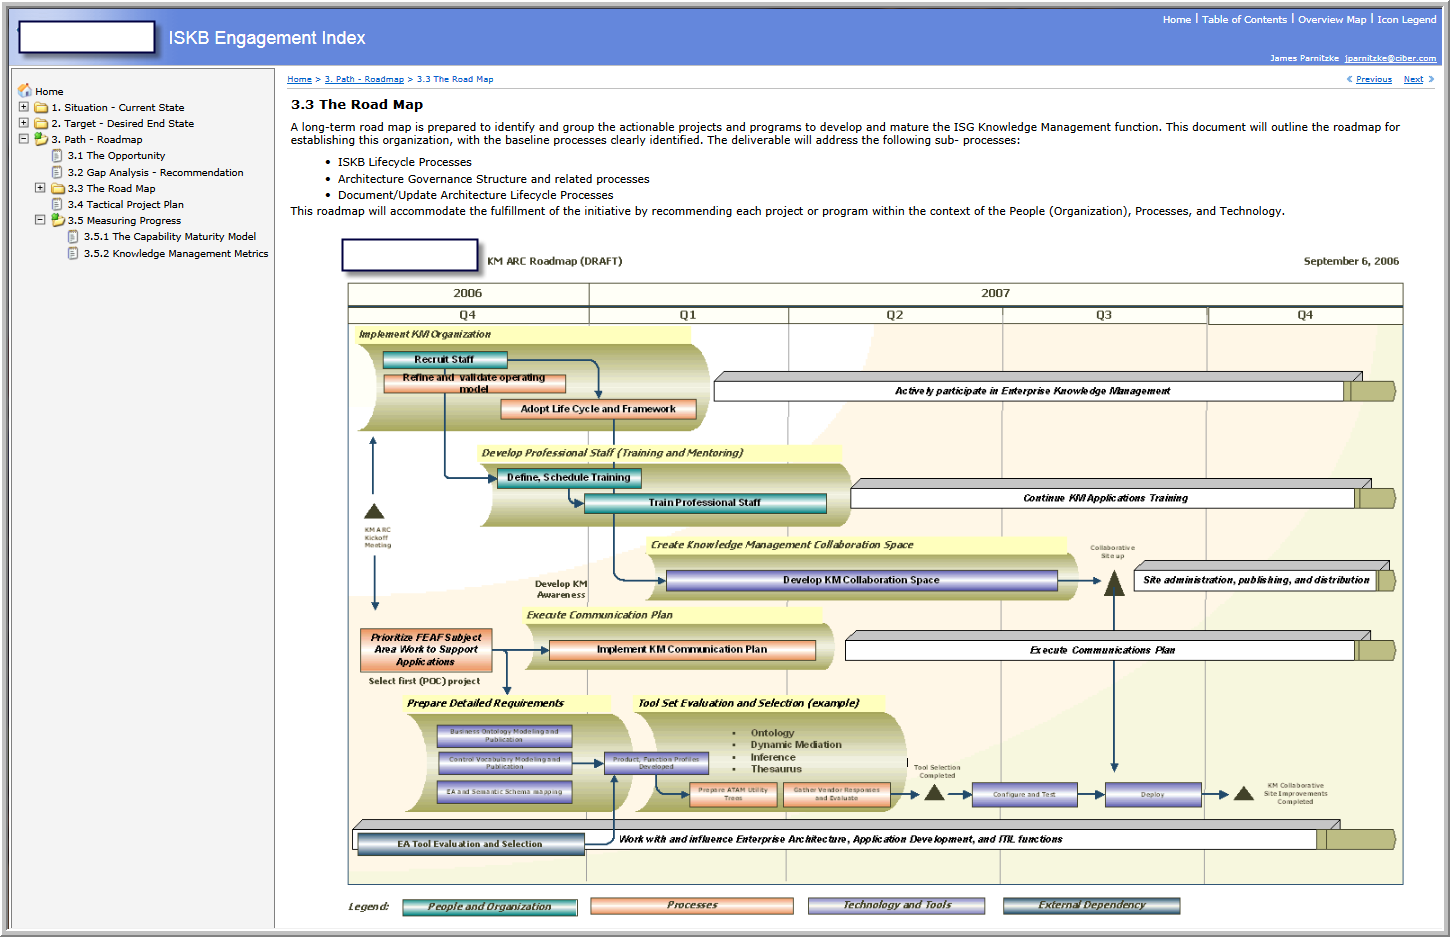
This post wraps up all the hard work to date and assembles the road map to begin sharing the results with stakeholders.  Assuming all the prior work is completed, we are now ready to develop and publish the road map. How this is communicated is critical now. We have the facts, we have the path outlined, and we have a defensible position to share with our peers. We have the details readily available to support our position. Now the really difficult exercise rears its ugly head. Somehow, we need to distill and simply our message to what I call the “Duckies and Goats” view of the world. In other words we need to distill all of this work into a simplified yet compelling vision of how we transform an organization, or enabling technology to accomplish what is needed. Do not underestimate the difficulty in this task. After all the hard work put into an exercise like this, the last thing we need to do is to confuse our stakeholders with mind-numbing detail. Yes, we need this for ourselves to exhaust any possibility we have missed something to ensure we haven’t overlooked the obvious because sometimes “when something is obvious, it may be obviously wrong”.  So what I recommend is a graphical one or two page view of the overall program where each project is linked to successive layers of detail. Each of these successive layers of detail can also be decomposed further if needed to the detailed planning products and supporting schedules. For an example of this see the accompanying diagram which illustrates the concept..

RoadMapExplodedDevelop the Road Map
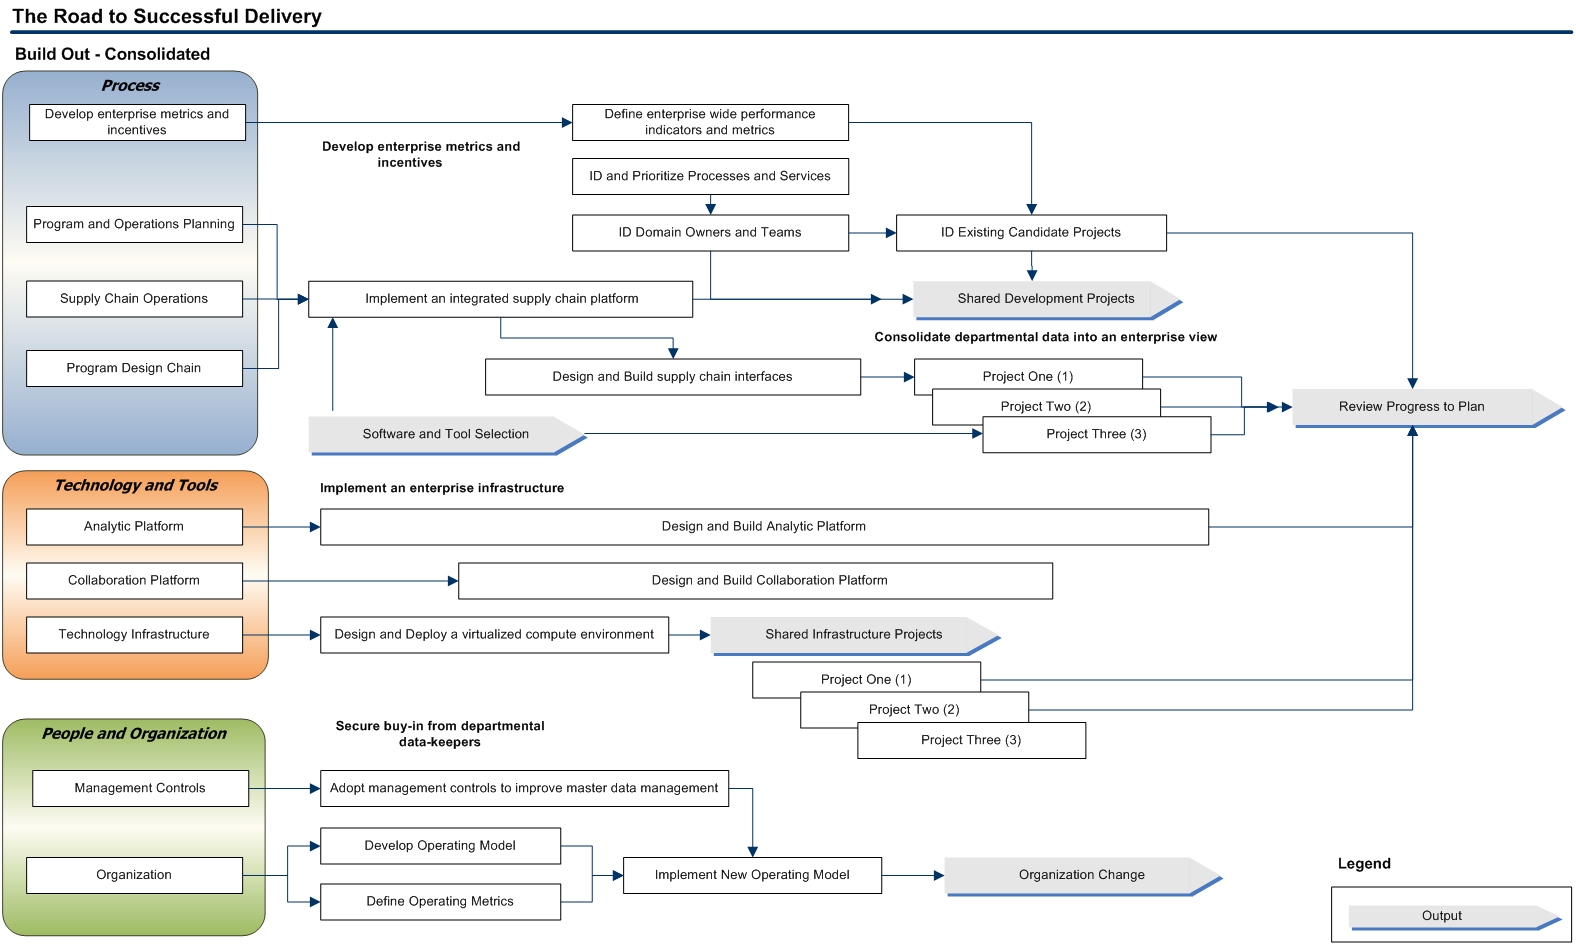
Armed with the DELTA (current vs. desired end state), the prioritization effort (what should be done), and the optimum sequence (in what order) we can begin to assemble a sensible, defensible road map describing what should be done in what order.  Most of the hard work has already been completed so we should be only be concerned at this point with the careful presentation of the results in a way our stakeholders will quickly grasp and understand.

Begin by organizing the high-level tasks and what needs to be accomplished using a relative time scale usually more fine grained for the first set of tasks typically grouped into quarters.  Recall each set of recommended initiatives or projects has already been prioritized and sequenced (each of the recommended actions recognize predecessor – successor relationships for example).  If this gets too out-of-hand use a simple indexing scheme to order the program using groupings of dimension, priority, sequence, and date related values with your favorite tool of choice.  Microsoft Excel pivot tables work just fine for this, and will help organize this work quickly.  I use the MindJet MindManager product to organize the results into maps I can prune and graft at will.  Using this tool has some real advantages we can use later when we are ready to publish the results and create our detailed program plans.

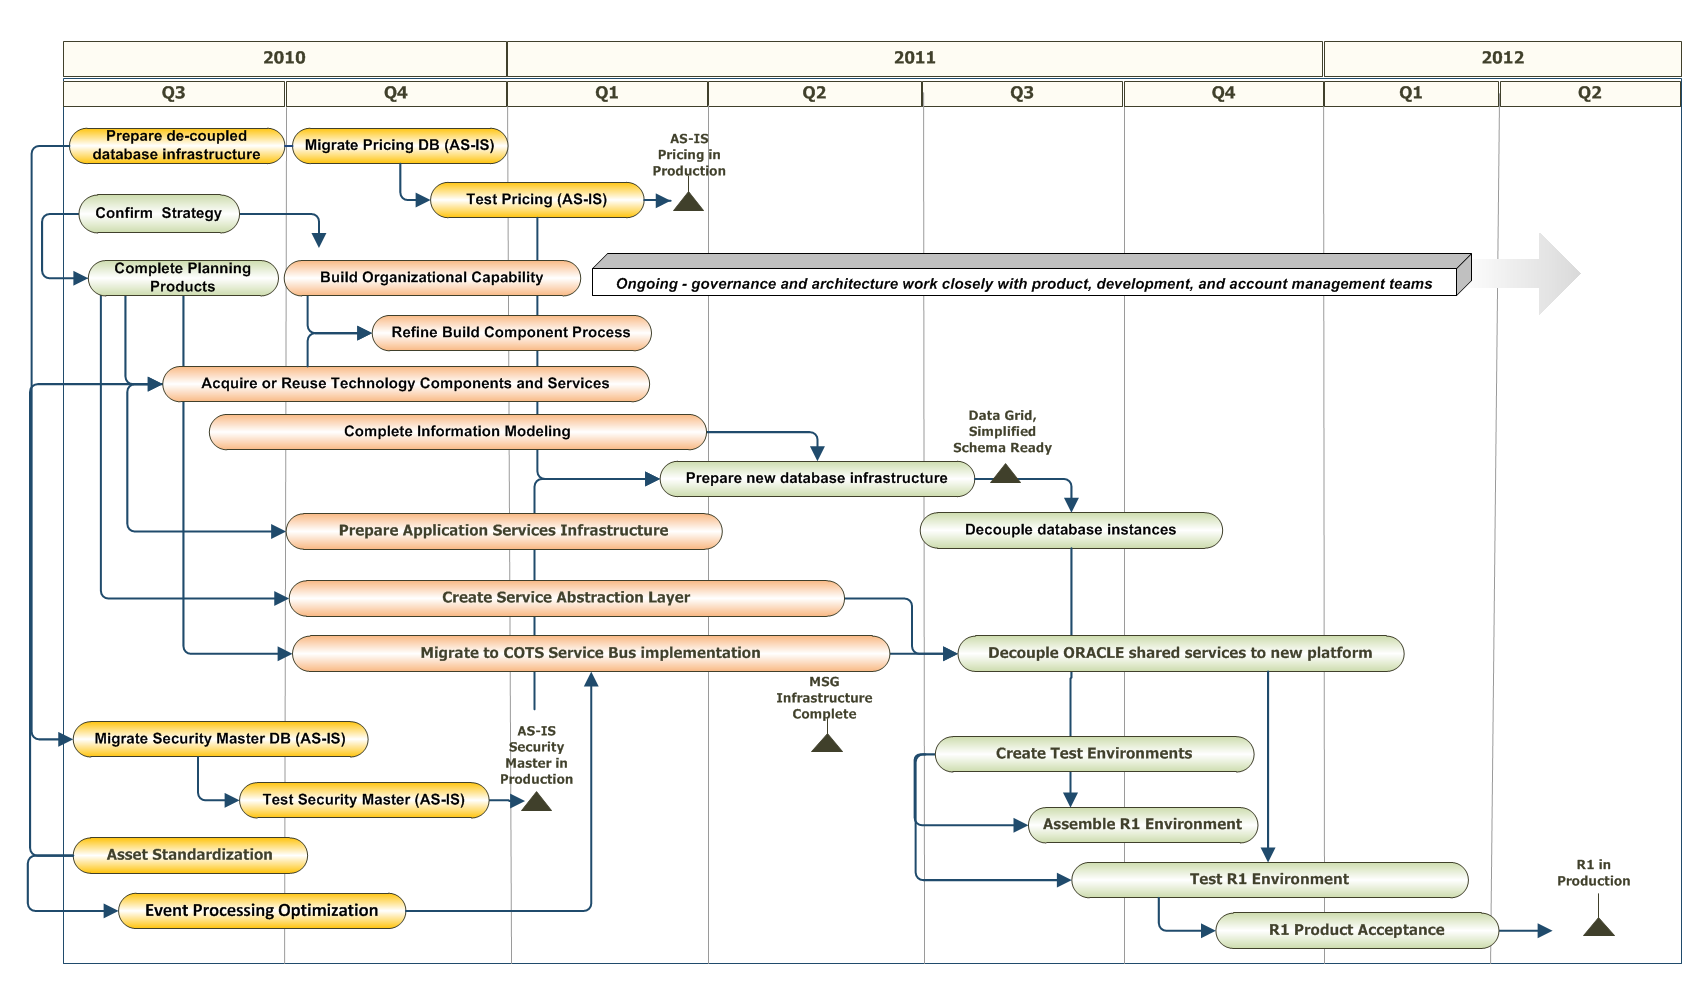
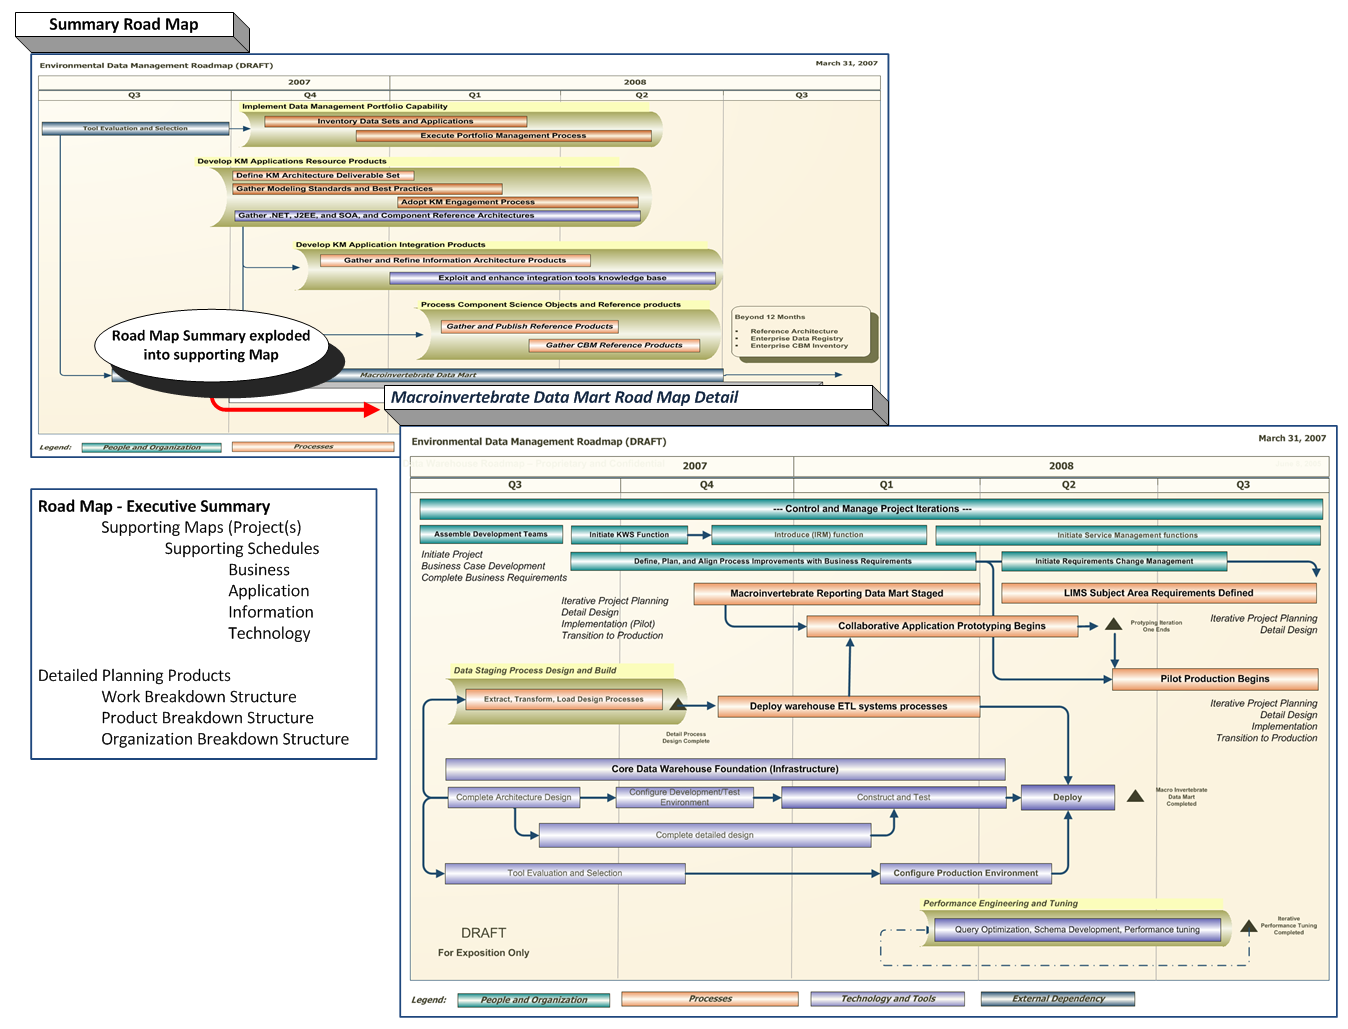
Each project (task(s)) should be is defined by its goals, milestone deliveries, dependencies, and expected duration across relevant dimensions. For example, the dimensions you group by can include People and Organization, Processes, Technology and Tools, and External Dependencies.  The following illustrates a high-level view of an example Master Data Management roadmap organized across a multiple year planning horizon.

PIM_Hub_01I think it is a good idea to assemble the larger picture first and then focus on the near term work proposed in the road map.  For example, taking the first quarter view of what needs to be accomplished from the executive summary above we can see the first calendar quarter (in this case Q4 2009) of the road map is dedicated to completing the business case, aligning the global strategy, preparing the technical infrastructure for a MDM Product project, and gaining a better understanding of product attribution.  The following illustrates the tasks exploded in the summary to the near term map of what is needed in Q4 2009 (the first quarter of this program).

PIM_Hub_02

Publish the Road Map
At this stage everything we need is ready for publication, review by the stakeholders, and the inevitable refinements to the plan. I mentioned earlier using MindJet MindManager tool to organize the program initiatives into maps.  This tool really comes in handy now to accelerate some key deliverables. Especially useful is the ability to link working papers, schedules, documentation, and any URL hyperlinks needed to support the road map elements. Many still prefer traditional documents (which we can produce with this tool easily) but the real power is quickly assembling the work into a web site that is context aware and a quite powerful way to drill from high level concepts to as much supporting detail as needed.  This can easily accessible without the need for source tools (this is a zero footprint solution) by any stakeholder with a browser. The supporting documentation and URL content can be revised and updated easily without breaking the presentation surface when revisions or refinements are made to the original plan.  I also use the same tool and content to generate skeleton program project plans for us with MS Project. The plans generated can be further refined and used to organize the detailed planning products when ready. Your Program Management Office (PMO) will love you for this.

Think you would agree this is an extremely powerful way to organize and maintain a significant amount of related program content to meet the needs of a wide variety of stakeholders.   An example of a Road Map web site is illustrated in the snapshot below (note, the client name has been blocked to protect their privacy).

SiteImage_02

Results
So, we have assembled the roadmap using a basic pattern used across any discipline (business or technology) to ensure an effective planning effort. This work is not an exercise to be taken lightly. We are after all discussing some real world impacts to come up with a set of actionable steps to take along the way that just make sense. Communicating the findings clearly through the road map meets the intent of the program management team and will be used in a variety of different ways.  For example beyond the obvious management uses consider the following ways this product will be used.

First, the road map it is a vehicle for communicating the program’s overall intent to interested stakeholders at each stage of its planned execution.

  • For downstream designers and implementers, the map provides overall policy and design guidance. The map can be used to establish inviolable constraints (plus exploitable freedoms) on downstream development activities to promote flexibility and innovation if needed.
  • For project managers, the road map serves as the basis for a work, product, and organization breakdown structures, planning, allocation of project resources, and tracking of progress by the various teams.
  • For technical managers, the road map provides the basis for forming development teams corresponding to the work streams identified.
  • For designers of other systems with which this program must interoperate, the map defines the set of operations provided, required, and the protocols that allows the interoperation to take place at the right time.
  • For resource managers, testers and integrators, the road map dictates the correct black-box behavior of the pieces that must fit together.

Secondly, the road map can be used as a basis for performing up-front analysis to validate (or uncover deficiencies in) in design decisions and refining or altering those decisions where necessary.

  • For the architect and requirements engineers who represent the customer(s), the road map is a framework where architecture as a forum can be used for negotiating and making trade-offs among competing requirements.
  • For the architect and component designers, the road map can be a vehicle for arbitrating resource contention and establishing performance and other kinds of run-time resource consumption budgets.
  • For those wanting to develop using vendor-provided products from the commercial marketplace, the road map establishes the possibilities for commercial off-the-shelf (COTS) component integration by setting system and component boundaries.
  • For performance engineers, the map can provide the formal model guidance that drives analytical tools such as rate schedulers, simulations, and simulation generators to meet expected demands at the right time.
  • For development product line managers, the map can help determine whether a potential new member of a product family is in or out of scope, and if out, by how much.

Thirdly, the road map is the first artifact used to achieve program and systems understanding.

  • For technical mangers, the map becomes a basis for conformance checking, for assurance that implementations have in fact been faithful to the program and architectural prescriptions.
  • For maintainers, the map becomes a starting point for maintenance activities, revealing the relative date and areas when a prospective change is planned to take place.
  • For new project members, the map is should be the first artifact for becoming familiar with a program and system’s design intent.

This post wraps up all the hard work to date and assembles the road map to begin sharing with stakeholders impacted by the program as planned.  The original intent was to share a time tested method to develop, refine, and deliver a professional roadmap producing consistent and repeatable results.  I want to thank all of you embarking down this adventure with me over the last couple years. My sincere hope is that what has worked for me time after time may work just as well for you.

How to build a Roadmap – Sequence

An earlier post (How to Build a Roadmap)  in this series summarized the specific steps required to develop a well thought out road map. This roadmap identified specific actions using an overall pattern ALL roadmaps should follow. The steps required to complete this work:

  1. Develop a clear and unambiguous understanding of the current state
  2. Define the desired end state
  3. Conduct a Gap Analysis exercise
  4. Prioritize the findings from the Gap Analysis exercise into a series of gap closure strategies
  5. Discover the optimum sequence of actions (recognizing predecessor – successor relationships)
  6. Develop and Publish the Road Map

This post explores the step where we discover the optimum sequence of actions recognizing predecessor – successor relationships. This is undertaken now that we have the initiatives and the prioritization is done. What things do we have to get accomplished first, before others? Do any dependencies we have identified need to be satisfied before moving forward? What about the capacity for the organization to absorb change? Not to be overlooked, this is where a clear understanding of the organizational dynamics is critical (see step number 1, we need to truly understand where we are). FuturesWheelThe goal is to collect and group the set of activities (projects) into a cohesive view of the work ordered in a typical leaf, branch, and trunk pattern so we can begin to assemble the road map with a good understanding what needs to be accomplished in what order.

Finding or discovering the optimal sequence of projects within the larger program demands you be able to think across multiple dimensions recognizing where there may be second and third order consequences for every action undertaken (see the Future Wheel method for more on this). More of craft than a science the heuristic methods I use refer to experience-based techniques for problem solving, learning, and discovery. This means that the solution is not guaranteed to be optimal. In our case, where an exhaustive search is impractical, I think using heuristic methods to speed up the process of finding a satisfactory solution include using rules of thumb, educated assumptions, intuitive judgment, some stereotyping, and lot of common sense. In our case optimization means finding the “best available” WBS_Diagramordered set of actions subject to the set of priorities and constraints already agreed upon.  The goal is to order each finding from the Gap Analysis in a way that no one project within the program is undertaken without the pre-requisite capability in place. Some of you will see the tree diagram image is a Work Breakdown Structure.  And you are right. This is after all our goal and represents the end-game objective. The sequencing is used and re-purposed directly into a set of detailed planning products organized to guide the effort.

What to think about
Developing a balanced well-crafted road-map is based on the “best available” ordered set of actions subject to the set of priorities (and constraints) already agreed upon.  When you think about this across multiple dimensions it does get a little overwhelming so I think the best thing to do is break the larger components into something we can attack in pieces and merge together later. After this set of tasks is accomplished we should always validate and verify or assumptions and assertions made to ensure we have not overlooked a key dependency.

Technology layer overviewI’m not going to focus on the relatively straight forward task in the technology (infrastructure) domains many of us are familiar with. Following a simple meta-model like this one from the Essential Architecture project (simplified here to illustrate the key concepts) means we can grasp quickly the true impact of an adoption of a new capability would have, and what is needed to realize this in the environment as planned. Where I will focus is on the less obvious. This is the  relationships across the other three domains (Business, Information, and Applications) which will be dependent on this enabling infrastructure.  And no less important is the supporting organization ability to continue to deliver this capability when the “consultants” and vendors are long gone.

So if you look at the simple road map fragment illustrated below note the technology focus. Notice also what is missing or not fully developed. Although we have a bubble labeled “Build Organizational Capability” it is not specific and detailed enough to understand how important this weakness is to overcoming an improved product because of the technology focus.RoadMap_Example_01Understanding of this one domain (technology) becomes a little trickier when take into account and couple something like an Enterprise Business Motivation Model for example . Now we can extend our simple sequence optimization with a very thoughtful understanding of all four architecture domains to truly understand what the organization is capable of supporting. So I’m going to reach into organizational dynamics now assuming all of us have a very good understanding as architects of what needs to be considered in the information, application, and supporting technology domains.

Organization Maturity Models
Before diving into the sequence optimization we should step back and review some of our earlier work. As part of understanding current and desired end states we developed a pretty acute awareness of the organization profile or collection of characteristics to describe ourselves. There are many maturity models available (CMMI, Information Management Maturity Model at Mike 2.0, and the NAS CIO EA Maturity Model) that all share the same concepts usually expressed in five or six levels or profiles ranging from initiating (sometimes referred to as chaos) to optimized. Why is this important? Each of these profiles includes any number of attributes or values that can be quantified to gain a deeper understanding of capability. This where the heuristic of common sense and intuitive judgment is needed and overlooked only at the risk of failure.  For example, how many of us have been engaged in a SOA based adoption only to discover the technology is readily achievable but the organization’s ability to support widespread adoption to realize the value is not manageable or produces unintended consequences.  Why does this happen so often? One of the key pieces of insight I can share with you is there seems to be a widespread assumption you can jump or hurdle one maturity profile to another by ensuring all prerequisite needs are adopted and in use.  Here is a real world case to illustrate this thought.

SOA_Architecture_Capability

Note there were thirteen key attributes evaluated as part of the global SOA adoption for this organization. What is so striking about this profile (this is not my subjective evaluation, this is based on the client’s data) is the relative maturity of Portfolio Management and integration mechanisms and the low maturity found in some core competencies related to architecture in general.  Core competency in architecture is key building block to adopting SOA on the size and scale as planned.   The real message here is this organization (at least in the primary architecture function) is still a Profile 1 or Initiating. Any attempt to jump to a Defined or even Managed profile cannot happen until ALL key characteristics are addressed and improved together.  The needle only moves when the pre-requisites are met. Sounds simple enough, can’t count how often something this fundamental is overlooked or ignored.

Organization Profile
This is a little more sophisticated in its approach and complexity. In this case we are going to use a maturity model that attempts to clarify and uncover some of the organizational dynamics referred to earlier in our Gap Analysis. This model is based on the classic triangle with profiles ranging from Operational to Innovating (with a stop at Optimizing along the way).  Each profile has some distinct characteristics or markers we should have recognized when base lining the Current State (if you used the Galbraith Star Model to collect you findings, its results can always be folded or grouped into this model as well).  Within each of the profiles there a couple of dimensions that represent the key instrumentation to measure the characteristics and attributes of the organization’s operating model. This is useful to measure as the organization evolves from one Profile to another and begins to leverage the benefits of each improvement in reach and capability.

Profile Triangle

We use this to guide us to select the proper sequence. The dimensions used within each of the six profiles in this model include:

Infrastructure (Technology)
The computing platforms, software, networking tools, and technologies (naming services for example) used to create, manage, store, distribute and apply information.  This is the Technology architecture domain I referred to earlier.

Processes
Policies, best practices, standards and governance that define: how information is generated, validated and used.  How information is tied to performance metrics and reward systems.  How the company supports its commitment to strategic use of information.

Human capital
The information skills of individuals within the organization and the quantifiable aspects of their: 

    • capability, 
    • recruitment, 
    • training, 
    • assessment and 
    • alignment with enterprise goals.

Culture
Organizational and human influences on information flow — the moral, social and behavioral norms of corporate culture (as shown in the attitudes, beliefs and priorities of its members), as related to the use and value of information as a long-term strategic corporate asset.

What this reveals about our sequencing is vital to understanding key predecessor – successor relationships. For example, a Profile 1 (Initiating) organizations are usually successful due to visionary leaders, ambitious mavericks and plain good old-fashioned luck. Common characteristics include: 

  • Individual leaders or mavericks with authority over information usage 
  • Information infrastructure (technology and governance processes) that is nonexistent, limited, highly variable or subjective 
  • Individual methods of finding and analyzing information 
  • Individual results adopted as “corporate truth” without the necessary validation

Significant markers you can look for are usually found in the natural self-interests of individuals or “information mavericks” who will often leverage information to their own personal benefit. Individuals flourish at the expense of the organization. The silo orientation tends to reward individual or product-level success even as it cannibalizes other products or undermines enterprise profitability. Because success in this environment depends on individual heroics, there is little capability for repeating successful processes unless the key individuals remain the same. This dynamic never scales and in the worst cases the organization is impaired every time one of “these key employees” leaves taking their expertise with them.

By contrast a Profile 3 (Integrated) organization has acknowledged the strategic and competitive value of information. This organization has defined an information management culture (framework) to satisfy business objectives. Initiatives have been undertaken enhance the organization’s ability to create value for customers rather than catering to individuals, departments, and business units. Architecture integrates data from every corner of the enterprise — from operational/transactional systems, multiple databases in different formats and from multiple channels. The key is the ability to have multiple applications share common “metadata” — the information about how data is derived and managed. The result is a collaborative domain that links previously isolated specialists in statistics, finance, marketing and logistics and gives the whole community access to company-standard analytic routines, cleansed data and appropriate presentation interfaces. Common characteristics include:

  • Cross-enterprise information. 
  • Decisions made in the context of enterprise goals. 
  • Enterprise information-governance process. 
  • Enterprise data frameworks. 
  • Information-management concepts applied and accepted. 
  • Institutional awareness of data quality.

So how well do think adopting an enterprise analytic environment is going to work in a Profile I (Initiating) organization?  Do you think we have a higher probability of success if we know the organization is closer to a Profile III (Integrated) or higher?

I thought so.

In this case, the sequencing should reflect a focus on actions that will move and evolve the organization from a 1 (Initiating) to a 2 (Consolidated), eventually arriving at a 3 (Integrated) profile or higher.

Understanding the key characteristics and distinct markers found in the organization you are planning for at this stage will be a key success factor. We want to craft a thoughtful sequence of actions to address organization and process related gaps in a way to that is meaningful.  Remember has much as we wish, any attempt to jump to a higher profile cannot happen until ALL key characteristics are addressed and improved together.  So if we are embarking on a truly valuable program remember this fundamental.  In almost every roadmap I have reviewed or evaluated by others not very many of them seek to understand this critical perspective. Not really sure why this is the case since an essential element of success to any initiative is ensuring specific actionable activities and management initiatives include:

  • Building organizational capability, 
  • Driving organizational commitment, and 
  • The program will not exceed the organization’s capability to deliver.

Results
Now that we have gathered all the prioritized actions, profiled the organization’s ability to deliver, and have the right enabling technology decisions in the right order it’s time to group and arrange the findings. While the details should remain in your working papers there are a variety presentation approaches you can take here. I prefer to group the results into easy to understand categories and then present the high level projects together to the team as a whole.  In this example (simplified and edited for confidentiality) I have gathered the findings into two visual diagrams illustrating the move from a Profile 1 (Operational) labeled Foundation Building, to a Profile II (Consolidated) labeled Build Out.  I have also grouped the major dimensions (Infrastructure, Processes, Human Capital and Culture) into three categories labeled Process and Technology, and combined Human Capital and Culture into Organization to keep things simple.

First the Profile I diagram is illustrated below. Note we are “foundation building” or identifying the optimal sequence to build essential capability first.

Profile 1 Roadmap

The move to a Profile II (Consolidated) is illustrated below. In this stage we are now leveraging the foundation building from earlier actions to begin to leverage what is important and take advantage of the capability to be realized.

Profile 2 Roadmap

Note at this time there is no times scale used; only a relative size denoting an early estimate of the level of effort from the Gap Analysis findings.  There is however a clear representation of the order of what actions should be taken in what order.  With this information we are now ready to move to the next step to develop and publish the completed Road Map.

Priceless…

25 years, 170+ million customers affected, 5+ billion transactions processed…

Sounds like the old McDonald marquee tote board
(for those old enough to remember when they used to count burgers sold chain-wide).

february-2009-002_5

Actually everyone you see in this picture has had a hand in many of the products and services you use everyday and have come to rely on. Like shipping freight across the world, using a credit card, paying an electric bill, caring for a loved one in a hospital, or helping our young people protect this country of ours. I never really thought about this until we all got together for one evening last week to laugh about old times. And then it dawned on me when I realized the collective contribution this group has made to a number of lives. Call us clueless geeks, hopeless loons, but I for one count myself lucky to have had the good fortune to be associated with each and every one of them. They have enriched my life in so many ways. And the best part? I still get to see them every now and then and raise a glass or two to old times.

Priceless…

Decentralized Enterprise Architecture: Can It Actually Work?

Interesting read over at Architecture & Governance Magazine (http://www.architectureandgovernance.com/) written by Raghavendra (Rao) Subbarao (Raghavendra.subbarao@gmail.com) as “Decentralized Enterprise Architecture: Can It Actually Work?”. Think there are some good points made here for the case for and against centralized versus de-centralized operating models. I have discovered through bitter experience that a Federated model probably works the best for a number of reasons, but this is usually not very comfortable for most corporate senior management to embrace. Use of balanced matrix organization is a little more complex than the classic command and control models most are familiar with. But it does put hands-on practitioners where they are needed the most (in the field solving for real problems) and enables the kind of business relationships and trust needed to ensure the sum of the parts is greater than the whole.  No one likes to live with Ivory Tower dictates no matter how compelling a case can be made for them. I think we all agree that collaboration among peers leads to widespread use and adoption. This is the magic. And the true difference between time consuming confrontations over who holds the power of decision or the energetic, creative empowerment of all contributors that really gets things done. There is much more to this, but the argument should be shifted to understanding how to make a Federated model work. The truth is the solution is not in selecting a centralized vs. decentralized model. It is neither.

Where is Architecture when we really need it?

Times are tough. So tough, many are slashing important spending in Enterprise Architecture. For example, treating IT as a cost center managed in a cost-containment mode means for most they will overlook the truly significant opportunities to improve profitability, leadership, and ultimately brand share that may not come around again. Depending on who you believe, the average company IT spend is anywhere from 5% – 12% (financial services) percent of operating expense or 95% to 87% percent of operating expense that isn’t in IT. I think Howard Rubin’s organization (the benchmark guys) have found organization’s that treat IT spend as an investment and true enabler rather than cost is probably worth anywhere from 2 to 5 percentage points in gross profit depending on the nature and intensity of IT in the business. Furthermore, I remember reading Empirimetric’s analysis during the last recession of 3,000 business units from more than 300 corporations found that operating effectiveness contributes to a company’s financial performance just slightly more than pure dumb luck and random events. A fresh perspective? Maybe; In fact if memory serves me the study revealed that profitability is directly and indirectly influenced by:

– Strategic moves initiated by the business: 10%
– Luck and random events: 10%
– Operating Expense Reductions: 15%
– Market Awareness, Competitive position, Customer Intimacy: 65%

So without sounding a little self-serving, you have to wonder what most of the leadership across industries (and the VC community as well – industry has no monopoly on being clueless) is thinking. Has the “paradox of thrift” or the hollow promises of “financial engineering” permeated everyone’s thinking? What can we do as pragmatic enterprise architects to help?  And reinforce our true value proposition when the financial engineers begin slashing and burning?  Maybe a good place to start is to begin thinking in business terms about some very real challenges our peers are addressing right now. For example, others have demonstrated:

– Up to 50% of existing customer relationships are not profitable.
– A 5% increase in retention can increase profits 60-100%.
– It costs 7-10 times as much to acquire a new customer as it does to retain existing customers.
– Long-term customers buy more, take less of a company’s time, and are less sensitive to price.
– Fortune 500 companies typically turn over (lose) over 50% of their customers every 5 years
– The average company communicates 4 times per year with its customers and 6 times per year with its prospects (you have to love this one <g>).

As architects we can add real value to solve for these issues by gaining an acute understanding of what it takes to enable actionable results – beginning with key organizing principals (framework) to guide decisions from funding to widespread adoption. For example,

– We can identify unprofitable customers, products, segments through robust analytics
– Improve delivery capacity (utilization, planned vs. unplanned) by enabling a more effective understanding of the portfolio of goods and services as delivered across organization boundaries
– Help the business adopt Time Driven Activity Based Costing to quickly gather and model findings
– Enable operating model optimization – shift to more value-added work. Use analytics or MDM to identify opportunities to automate or replace low value-added essential activity (e.g.; hunting and gathering data points, duplicate validation and verification of data values) and measure progress to plan as action is taken.
– Improve Process cycle velocity. Identify unnecessary latency, waste, rework in work streams and reengineer or eliminate altogether. 

These are a few examples where the applied architecture makes sense; business sense.  For those of us in architecture management we have a responsibility in our role is to ensure technology investment and widespread adoption within the organization occurs because:

– The investment has value,
– The program (projects) will be properly managed,
– The organization has the capability to deliver the benefits,
– Dedicated resources are working on the highest value opportunities,
– Projects with inter-dependencies are undertaken in the optimum sequence.

Will explore some real world examples in the coming weeks, and welcome your thoughts and comments on this important and urgent need.