 This post is part of a larger series to provide a detailed set of steps you can take to unlock breakthrough results in Big Data Analytics. The simple use case used to illustrate this method will address the perplexing management challenge of platform and tool optimization. This step is used to identify the types and nature of the operating models used within the analytic community. I’m using a proven approach for solving platform and tool optimization in the same manner that proven practice suggests every analytic decision be made. Here we are simply using an organizing principle to group and categorize our findings in what can quickly become a bewildering experience (much like herding cats) in its complexity and nuance.
Recall the nine steps to take as summarized in a prior post.
1) Gather current state Analytic Portfolio, and compile findings.
2) Determine the Analytic Operating Models in use.
3) Refine Critical Analytic Capabilities as defined.
4) Weight Critical Analytic Capability according to each operating model.
5) Gather user profiles and simple population counts for each form of use.
6) Gather platform characteristics profiles.
7) Develop platform and tool signatures.
8) Gather data points and align with the findings.
9) Assemble decision model for platform and tooling optimization.
Let’s start with examining the type and nature of the analytic operating models in use. Note an organization of any size will most likely use two or more of these models for very good reasons. I myself have seen all of these models employed at the same organization in my own practice. When moving on to the remaining steps it will become increasingly evident that having a keen understanding of the strategy, organization, technology footprint, and culture that drives the model adoption in question will become invaluable. First, let’s define our terms.
What is an operating model?
Wikipedia defines an operating model as an abstract representation of how an organization operates across a range of domains in order to 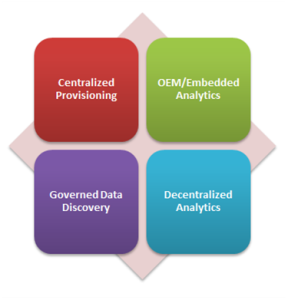 accomplish its function. An operating model breaks this system into components, showing how each works together. It helps us understand the whole. In our case we are going to focus on the analytic community and use this understanding to evaluate fit when making changes to ensure the enabling models will still work after the recommended optimization is called for. Thanks to Gartner who published Critical Capabilities for Business Intelligence and Analytics Platforms this summer (12 May 2015 ID:G00270381) we have a reasonably good way to think about form and function across the different operating models which Gartner refers to in their work as baseline use cases to include.
– Centralized Provisioning,
– Decentralized Analytics,
– Governed Data Discovery, and
– OEM/Embedded Analytics.
You may think what you will about Gartner I believe they have done a good job of grouping and characterizing the signatures around the four (4) operating models using fifteen (15) critical analytic capabilities to further decompose the form and function found within each. At a summary level the capabilities are grouped as follows.
– Traditional Styles of Analysis
– Analytic Dashboards and Content
– IT-Developed Reports and Dashboards
– Platform Administration
– Metadata Management
– Business User Data Mash-up
– Cloud Deployment
– Collaboration and Social Integration
– Customer Services
– Development and Integration
– Ease of Use
– Embedded Analytics
– Free Form Interactive Exploration
– Internal Platform Integration
– Mobile
Note: Detailed descriptions and characteristics of each of the fifteen (15) critical capabilities can be found in step three (3) where I will refine the Gartner definitions of Critical Analytic Capabilities to add additional context.
Why is this important?
Each of the four models have very different needs influenced by strategy, footprint, and culture of the organization. Each optimization will have to recognize their differences and accommodate for them to remain meaningful. A set of tools and  platforms which are ideal for Centralized Provisioning are usually terrible and completely unsuited for use within a Decentralized Analytics operating model. Critical capability essential to Embedded Analytics is very different from Governed Data Discovery. Yes there are some capabilities that cross operating models (e.g. metadata), and some that are far important than others. In general this is a truly sound way to determine where your investment in capability should be occurring – and where it is not. Along the way you will surely stumble across very clever professionals who have solved for their own operating model limitations in ways that will surprise you. And some just downright silliness; remember culture plays a real and present role in this exercise. At a minimum I would think carefully about what you uncover across the following facets or dimensions.
- Structure is drawing boundaries for each analytic community, defining the horizontal mechanisms that ensure coordination and scale, and evaluating the resource levels that reflect the roles of the each. It should define the high-level organization chart if form follows function. If you look carefully, the clues to helping understand and classify each model are there. And note some overlap and redundancy is expected between each of the models.
- Accountability describes the roles and responsibilities of the organizational entities within each model and clarify how organizational units come together to make effective cross-enterprise analytic decisions. This is where a lot of organizational friction can occur resulting in undefined behaviors and unnecessary ambiguity.
- Governance refers to the configuration and cadence for discussing and resolving issues of strategy, resource allocation (including talent), performance management and other matters under each model. Note the wide variety of skills and competencies needed under each model and the potential for a rapid proliferation of tools and methods.
- Working describes how people collaborate across the seams that lie between different models. Behavior that’s consistent with intended values is critical to effective execution. Less understood by many, remember you really can’t do effective predictive or prescriptive analytic work without the descriptive or diagnostic data sets usually prepared by others under what is typically a very different operating model.
- Critical Capability can be determined by using the collection referred to above to balance people, processes and technology investment. The choice of operating models has implications for the type of talent or technology platform and tool optimization required. This collection is a suggestion only (and a good one at that), in step three I will refine this further to illustrate how to extend and refine this set of capabilities.
Step Two – Determine the operating models in use
In this step we are going to gather a deep understanding for the characteristics within each operating model, where they differ, and what common components and critical capability are shared. If you read the Gartner reference they consider metadata to be most heavily weighted in the Centralized Provisioning and Governed Discovery models. Based on my experience it is just as critical (and perhaps even more so) in the Decentralized model as well, especially in the Big Data world where tools like Alation, Adaptive, and Tamr are becoming essential to supporting discovery and self-service capability. The rest of this post will briefly describe the key characteristics for each operating model, their signature attributes, and highlight a few differences to help determine which operating models are employed.
Centralized Provisioning
 The classic model used for years in delivery of what has been referred to as business intelligence. Typically we would find tight management controls to push through centralized strategy and efficiency, usually at a high cost. Tightly managed processes for collecting and cleaning data before consumption can be found in the classic patterns associated with Extract, Transform, and Load operations into a data warehouse or mart. Most often characterized by formal processes where a developer or specialists collects business requirements from the users and then creates sanctioned reports and dashboards for them on trusted data. Centralized provisioning enables an information consumer to access their Key Performance Indicators (KPIs) from an information portal — increasingly on a mobile device or embedded in an analytic application — to measure the performance of the business. Interactivity and discovery in centrally developed content is limited to what is designed in by the content author. Seven of fourteen most important capabilities needed this model would include:
– IT-Developed Reports and Dashboards
– Traditional Styles of Analysis
– Platform Administration
– Development and Integration
– Metadata Management
– Ease of Use
– Customer Services
Decentralized Analytics
 The opposite of centralized provisioning, this model or loose confederation encourages local optimization and entrepreneurial drive. Look for a community that rapidly and interactively explores trends or detects patterns in data sets often from multiple sources to identify opportunities or risks with minimal support from the IT development community. Interactivity and discovery in this model is NOT limited to what is designed in by the content authors we find in the Centralized Provisioning model. The users are the content authors. Users of platforms and tools that excel at the decentralized analytics model can explore data using highly interactive descriptive analytic (“what happened” or “what is happening”) or diagnostic analytic (“Why did something happen?”, “Where are areas of opportunity or risk?”, and “What if?”). Because of embedded advanced analytic functions offered by many vendors, users can extend their analysis to some advanced descriptive analysis (for example, clustering, segmenting and correlations) and to a basic level of predictive analytic (for example, forecasting and trends). They can also prepare their own data for analysis, reducing their reliance on IT and improving time to insight. As decentralized analytics becomes more pervasive, the risk of multiple sources of the truth and information governance itself becomes a real challenge. Six of fourteen most important capabilities important capabilities needed in this model would include:
– Analytic Dashboards and Content
– Free Form Interactive Exploration
– Business User Data Mashup and Modeling
– Metadata Management
– Ease of Use
– Customer Services
Governed Data Discovery
 A hybrid of centralized and decentralized this model is best characterized by offering freedom within a framework to enhance transparency and effectiveness. This model features business users’ ability to prepare and combine data, explore and interact visually with this data to enable discovery to be deployed and managed across the enterprise. With the success of data discovery tools in driving business value, there is an increasing demand to use data discovery capabilities for a broader range of analysis and an expanded set of users than previously addressed by traditional reporting and dashboards. Governed data discovery enables users to access, blend and prepare data, then visually explore, find and share patterns with minimal IT support using their own technical and statistical skills. At the same time, this model must also satisfy enterprise requirements for business-user-generated model standards, data reuse and governance. In particular, users should be able to reuse sanctioned and approved business-user-created data or data sets, derived relationships, derived business models, derived KPIs, and metrics that support analyses.
Governed data discovery can enable pervasive deployment of data discovery in the enterprise at scale without proliferating data discovery tooling sprawl. The expanded adoption of data discovery also requires analytic leaders to redesign analytics deployment models and practices, moving from an IT-centric to an agile and decentralized, yet governed and managed approach. This would include putting in place a prototype, pilot and production process in which user-generated content is created as a prototype. Some of these prototypes would need to be used in recurring analysis and promoted to a pilot phase. Successful pilots are promoted to production and operationalized for regular analysis as part of the system of record. Each step provides more rigor and structure in governance and Quality Assurance testing. Business user data mashup and modeling, administration, and metadata capabilities should be based understanding on the following characteristics which would differentiate a Governed model from the Decentralized Analytics model discussed earlier. Pursuing the following questions will help define the differences.
– Where are permissions enabled on business models?
– Who can access shared data connections and data sets?
– Who can create and publish data sets?
– Who can access shared user work spaces to publish visualizations?
– Is there shared metadata about usage, connections and queries ?
– Are usage, connections and queries monitored?
– Is there a information catalog available to enable discovery?
Eight of fourteen most important capabilities needed in this model would include:
– Analytic Dashboards and Content
– Free Form Interactive Exploration
– Business User Data Mashup and Modeling
– Internal Platform Integration
– Platform Administration
– Metadata Management
– Ease of Use
– Customer Services
Embedded Analytics
 In this model analytics (decisions, business rules, and processes) are integrated into the organization to capture economies of scale and consistency across planning, operations, and customer experience. Most typically found where developers are using software development kits (SDKs) and related APIs to include advanced analytics and statistical functions within application products. These capabilities are used to create and modify analytic content, visualizations and applications and embed them into a business process, application or portal. Analytic functions can reside outside the application, reusing the infrastructure but should be easily and seamlessly accessible from inside the application, without forcing users to switch between systems. The ability to integrate analytics with the application architecture will enable the analytic community to choose where in the business process the analytics should be embedded. On example of a critical capability for embedding advanced analytics would include consuming a SAS/R or PMML model to create advanced models embedded in dashboards, reports or data discovery views. Six of the fourteen most important capabilities needed in this model would include:
– Embedded (includes both developer and embedded advanced analytics)
– Cloud Deployment
– Development and Integration
– Mobile
– Ease of Use
– Customer Services
Putting It All Together
Believing form really does follow function it should be clear after this step what operating models are driving the platforms and tools that are enabling (or inhibiting) effective performance. Using the Gartner work and the refinements I have extended this with we can now see at a glance what core capabilities are most important to each model as illustrated in the following diagram. This will become a key input to consider when assembling the decision model and discovering platform and tooling optimization in the later steps.

Now that this step is completed it is time to turn our attention to further refining the critical analytic capabilities as defined and begin weighting each according to their relative importance to each operating model. It will become increasingly clear why certain critical capabilities essential to one model will be less important to another when this task is completed.
If you enjoyed this post, please share with anyone who may benefit from reading it. And don’t forget to click the follow button to be sure you don’t miss future posts. Planning on compiling all the materials and tools used in this series in one place, still unsure of what form and content would be the best for your professional use. Please take a few minutes and let me know what form and format you would find most valuable.
Suggested content for premium subscribers:
Big Data Analytics - Unlock Breakthrough Results: Step Two (2)
Operating Model Mind Map (for use with Mind Jet - see https://www.mindjet.com/ for more)
Analytic Core Capability Mind Map
Enterprise Analytics Mind Map
Analytics Critical Capability Workbooks
Analytics Critical Capability Glossary, detailed descriptions, and cross-reference
Logical Data Model (XMI - use with your favorite tool)
Reference Library with Supporting Documents


