The Analytic User Profile
 Understanding that form follows function we are now going to develop one of the most important interim products for our decision model; the analytic user profile. A profile is a way of classifying and grouping what the user community is actually doing with the analytic information and services produced. This step will develop a quantified view of our user community so we can evaluate each platform or tool for optimization quickly and produce meaningful results aligned with usage patterns. We already know that one size does not fit all (see Big Data Analytics and Cheap Suits). Selecting the right platform for the right job is important to success. This step will attempt to quantify a couple of key data points we can use to:
- distinguish actual usage patterns (e.g. casual users from power users)
- match resulting profiles to platform capability
- match resulting profiles to tool categories
- gain a deeper understanding of what the community of producers and consumers really needs.
Along the way we are going to explore a couple of different approaches used to solve for this important insight.
What is an Analytic User Profile?
A user profile is a way of classifying and grouping what the community is actually doing with the analytic information being produced and consumed. This can expressed with a simple diagram below. Note that typically 80% of the work is usually associated with review and retrieval of data using a descriptive or diagnostic analytic. The other 20% is related to the use of sophisticated predictive and prescriptive analytics used to augment the transaction data gathered and distributed for operational support. In what is now being labeled Big Data 3.0 analytic services are now being embedded into decision and operational processes, in effect combining analytic styles in ways that were just not possible a few years ago.
 Now we have a high level view of what is being done, who is doing this? There are several ways to classify and categorize roles or signatures. For example the diagram above includes terms like Miners, Explorers, and Gatherers (see the bottom axis for the labels). The following diagram illustrates another way to view this community using many of the same classification labels.

Of course you can refine this to any level of granularity you are comfortable with preserving the integrity of the classification. By that I mean preserving the function and not mixing form (like an organizational role as opposed to function). If you look at the diagram closely you will notice this diagram uses organizational roles and not functions like the first diagram. Use one or the other, but do not mix at your own peril. They mean very different things. There is no reason you can’t map one to the other and vice versa when needed.
Here is a table illustrating the analytic profile I use. Not perfect, but has served me well. This table includes the type of activity, optimal tool usage, and important functionality associated with each profile.
Form Follows Function – An Example
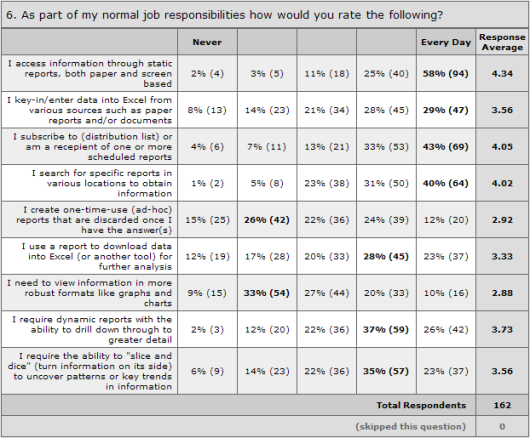
Think it be helpful to illustrate these abstract concepts with a real example. In this case we will use the concept of form following function by examining what kind of questions and answers are typically developed when measuring retail conversion rates (similar to digital channel conversion rates). This diagram illustrates the types of questions typically asked and the necessary analysis required to answer them. Note, as analytic capability matures two things occur, the questions become more predictive focused and the systems to answer them become more complex.
 Now here is the same diagram overlaid with the typical tools used to solve for and answer each important question.

Do you see what is missing? The analytic profile or type of user for each question and each answer is not present. Think carefully about which profile or role would ask the question and which would give the answer. It should be clear that answering a predictive or prescriptive question about optimization requires a very set of skills and tools than just rendering the results in a reporting platform or mobile device. And who and how many are categorized in each group? This is the next step.
Completing the Analytic User Profile
Now we have a good idea of the kinds of questions and answers we may find it is time to prepare a quick census. This is not a precision exercise rather one of just understanding the relative size and number of each profile found within the analytic and consuming community. There are several advanced statistical methods available to you if more precision (and the data is available) is needed. For a quick way to estimate these values I will share one method that works well enough for me. Recall the relative distribution of profiles can be modeled to look something like the distribution of analytic profiles found in the following diagram.
 Using simple mathematics we can perform a simple calculation to approximate missing values where we know one value in the data; if know there are 600 reviewers based on the number of distinct logins captured and normalized over a suitable time frame (assuming a normal distribution) across reporting platforms then we can expect the total community to number around 1,000 (600/.60 = 2,000). In this population using the model we can expect to find:
- 10 Data Scientists, Statisticians, and Miners creating statistical models using predictive and prescriptive analytics, sourced from internal and external data
- 40 Developers creating and maintaining reports, queries, OLAP cubes, reporting applications
- 50 Explorers analyze large amounts of data in an interactive, exploratory fashion
- 60 Planners performing “what if” analyses to create budgets or planning assumptions
- 600 Reviewers (known value) looking over a consistent set of data on a consistent basis (reporting), and drilling down to more detail only when something in awry in the data
- 240 Gatherers and Operations support professionals retrieving a specific piece of data in near real-time to perform a specific business process
Here is an actual sample of field-work completed using this method where the number of distinct log-ins across reporting platforms (27,050) was known and almost all log-ins could be classified and grouped as Reviewers. Note this is an approximation due to proxy or application identifier use, but it is good enough for now. This is a large organization and reflects a certain economies of scale. Your distribution model may not reflect this capability and may need to be adjusted.

Before you begin to question the accuracy and completeness of this exercise (and you should) note this work product only represents a quick rule of thumb or starting position. The results should be validated and confirmed or disproved with a more rigorous examination with the stakeholders. And of course the distribution model of the analytic profiles may be different based on your industry or line of business. This is quick. And only required one confirmed data point and a week of follow-up and confirmation within the organization.
If you have the time and need more precision (including a more sophisticated statistical analysis) there is always the tried and true field work option to collect more data points. This is usually performed as follows.
- Prepare profile census values and questionnaires. Develop the questions of the survey in general non-technical
 terms so that it could be understood by business users. Target a time of no more than 15 minutes to answer the questions. Provide a combination of single choice, multiple choice, rating scales and open ended questions to add variety and get more complete answers.
 - Prepare and distribute the survey across the organization under examination. Provide an easy to use web-based online survey that can be accessed over the Internet. Email internally to various distribution lists with a URL link to the online survey.
- Compile results
- Clean or fill missing values using the appropriate algorithmic filters
- Test the refined results for validity using sound statistical techniques
- Interpret the finding and prepare the data sets for publication
- Publish findings for review and comment
- Incorporate responses and revise findings to reflect stakeholder comments

If this sounds like a lot of work it is. This field work is not quick and will take months of labor intensive activity to do successfully. The good news is you will have a much more precise insight into the analytic community and what your users are actually doing. Capturing this insight can also give the information on business needs by determining who are using tools, what business questions are being answered using tools, when or how frequent tools are being used, where the tools are being used (against what data sources) and finally to assess how the existing tools are being used.
Summary
Understanding that form follows function, we have now developed one of the most important interim products for our decision model; the analytic user profile. A profile is a way of classifying and grouping what the user community is actually doing with the analytic information and services produced. These profiles can be used to:
- distinguish actual usage patterns (e.g. casual users from power users)
- match resulting profiles to platform capability
- match resulting profiles to tool categories
- gain a deeper understanding of what the community of producers and consumers really needs.
With a quantified view of the analytic community we can now evaluate each platform or tool for optimization quickly and produce meaningful results that are aligned with usage patterns in the upcoming decision model.
If you enjoyed this post, please share with anyone who may benefit from reading it. And don’t forget to click the follow button to be sure you don’t miss future posts. Planning on compiling all the materials and tools used in this series in one place, still unsure of what form and content would be the best for your professional use. Please take a few minutes and let me know what form and format you would find most valuable.
Suggested content for premium subscribers:
Operating Model Mind Map (for use with Mind Jet – see https://www.mindjet.com/ for more)
Analytic Core Capability Mind Map
Analytic User Profile workbooks
Enterprise Analytics Mind Map
Reference Library with Supporting Documents
Prior Posts in this series can be found at:
Big Data Analytics – Nine Easy Steps to Unlock Breakthrough Results
Big Data Analytics – Unlock Breakthrough Results: (Step 1)
Big Data Analytics – Unlock Breakthrough Results: (Step 2)
Big Data Analytics – Unlock Breakthrough Results: (Step 3)
Big Data Analytics – Unlock Breakthrough Results: (Step 4)


 This post is part of a larger series to provide a detailed set of steps you can take to unlock breakthrough results in Big Data Analytics. The simple use case used to illustrate this method will address the perplexing management challenge of platform and tool optimization. This step is used to identify the types and nature of the operating models used within the analytic community. I’m using a proven approach for solving platform and tool optimization in the same manner that proven practice suggests every analytic decision be made. Here we are simply using an organizing principle to group and categorize our findings in what can quickly become a bewildering experience (much like herding cats) in its complexity and nuance.
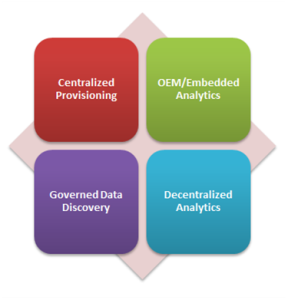 accomplish its function. An operating model breaks this system into components, showing how each works together. It helps us understand the whole. In our case we are going to focus on the analytic community and use this understanding to evaluate fit when making changes to ensure the enabling models will still work after the recommended optimization is called for. Thanks to Gartner who published
 The classic model used for years in delivery of what has been referred to as business intelligence. Typically we would find tight management controls to push through centralized strategy and efficiency, usually at a high cost. Tightly managed processes for collecting and cleaning data before consumption can be found in the classic patterns associated with Extract, Transform, and Load operations into a data warehouse or mart. Most often characterized by formal processes where a developer or specialists collects business requirements from the users and then creates sanctioned reports and dashboards for them on trusted data. Centralized provisioning enables an information consumer to access their
  The opposite of centralized provisioning, this model or loose confederation encourages local optimization and entrepreneurial drive. Look for a community that rapidly and interactively explores trends or detects patterns in data sets often from multiple sources to identify opportunities or risks with minimal support from the IT development community. Interactivity and discovery in this model is NOT limited to what is designed in by the content authors we find in the Centralized Provisioning model. The users are the content authors. Users of platforms and tools that excel at the decentralized analytics model can explore data using highly interactive descriptive analytic (“what happened” or “what is happening”) or diagnostic analytic (“Why did something happen?”, “Where are areas of opportunity or risk?”, and “What if?”). Because of embedded advanced analytic functions offered by many vendors, users can extend their analysis to some advanced descriptive analysis (for example, clustering, segmenting and correlations) and to a basic level of predictive analytic (for example, forecasting and trends). They can also prepare their own data for analysis, reducing their reliance on IT and improving time to insight. As decentralized analytics becomes more pervasive, the risk of multiple sources of the truth and information governance itself becomes a real challenge. Six of fourteen most important capabilities important capabilities needed in this model would include:
 A hybrid of centralized and decentralized this model is best characterized by offering freedom within a framework to enhance transparency and effectiveness. This model features business users’ ability to prepare and combine data, explore and interact visually with this data to enable discovery to be deployed and managed across the enterprise. With the success of data discovery tools in driving business value, there is an increasing demand to use data discovery capabilities for a broader range of analysis and an expanded set of users than previously addressed by traditional reporting and dashboards. Governed data discovery enables users to access, blend and prepare data, then visually explore, find and share patterns with minimal IT support using their own technical and statistical skills. At the same time, this model must also satisfy enterprise requirements for business-user-generated model standards, data reuse and governance. In particular, users should be able to reuse sanctioned and approved business-user-created data or data sets, derived relationships, derived business models, derived KPIs, and metrics that support analyses.
 In this model analytics (decisions, business rules, and processes) are integrated into the organization to capture economies of scale and consistency across planning, operations, and customer experience. Most typically found where developers are using software development kits (SDKs) and related APIs to include advanced analytics and statistical functions within application products. These capabilities are used to create and modify analytic content, visualizations and applications and embed them into a business process, application or portal. Analytic functions can reside outside the application, reusing the infrastructure but should be easily and seamlessly accessible from inside the application, without forcing users to switch between systems. The ability to integrate analytics with the application architecture will enable the analytic community to choose where in the business process the analytics should be embedded. On example of a critical capability for embedding advanced analytics would include consuming a SAS/R or PMML model to create advanced models embedded in dashboards, reports or data discovery views. Six of the fourteen most important capabilities needed in this model would include:


